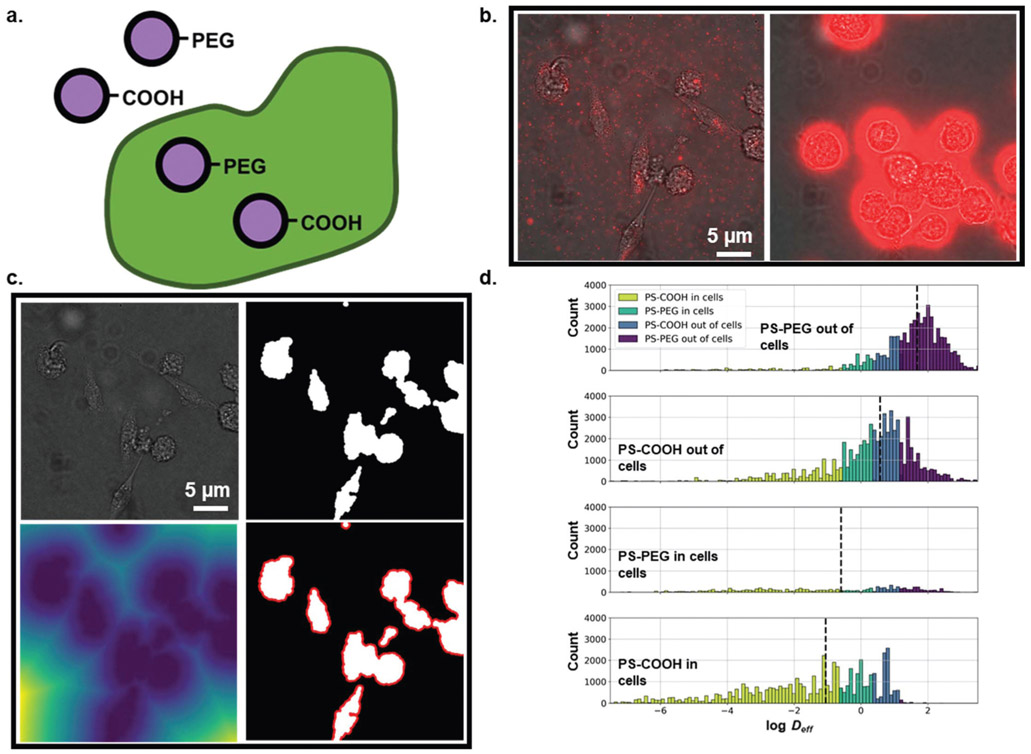
Fig. 5.
(a) Particle type- and cellular internalization-dependent diffusion analysis. (b) (left) Example frame of PS-PEG nanoparticle diffusion in BV-2 microglial cell culture. (right) Example frame of PS-COOH nanoparticle diffusion in BV-2 microglial cell culture. (c) Demonstration of cell image analysis. (top left) Raw image. (top middle) Binarized image. (top right) Euclidean distance transform of binarized image (bottom left). Binarized image with area 10 pixels from cell surfaces highlighted in red. (bottom middle) Binarized image with area 20 pixels from cell surfaces highlighted in red. (d) log Deff distributions stratified by agarose gel concentration binned by predicted agarose gel concentration using log median predictor (purple: PS-PEG out of cells, blue: PS-COOH out of cells, teal: PS-PEG in cells, yellow-green: PS-COOH in cells).

