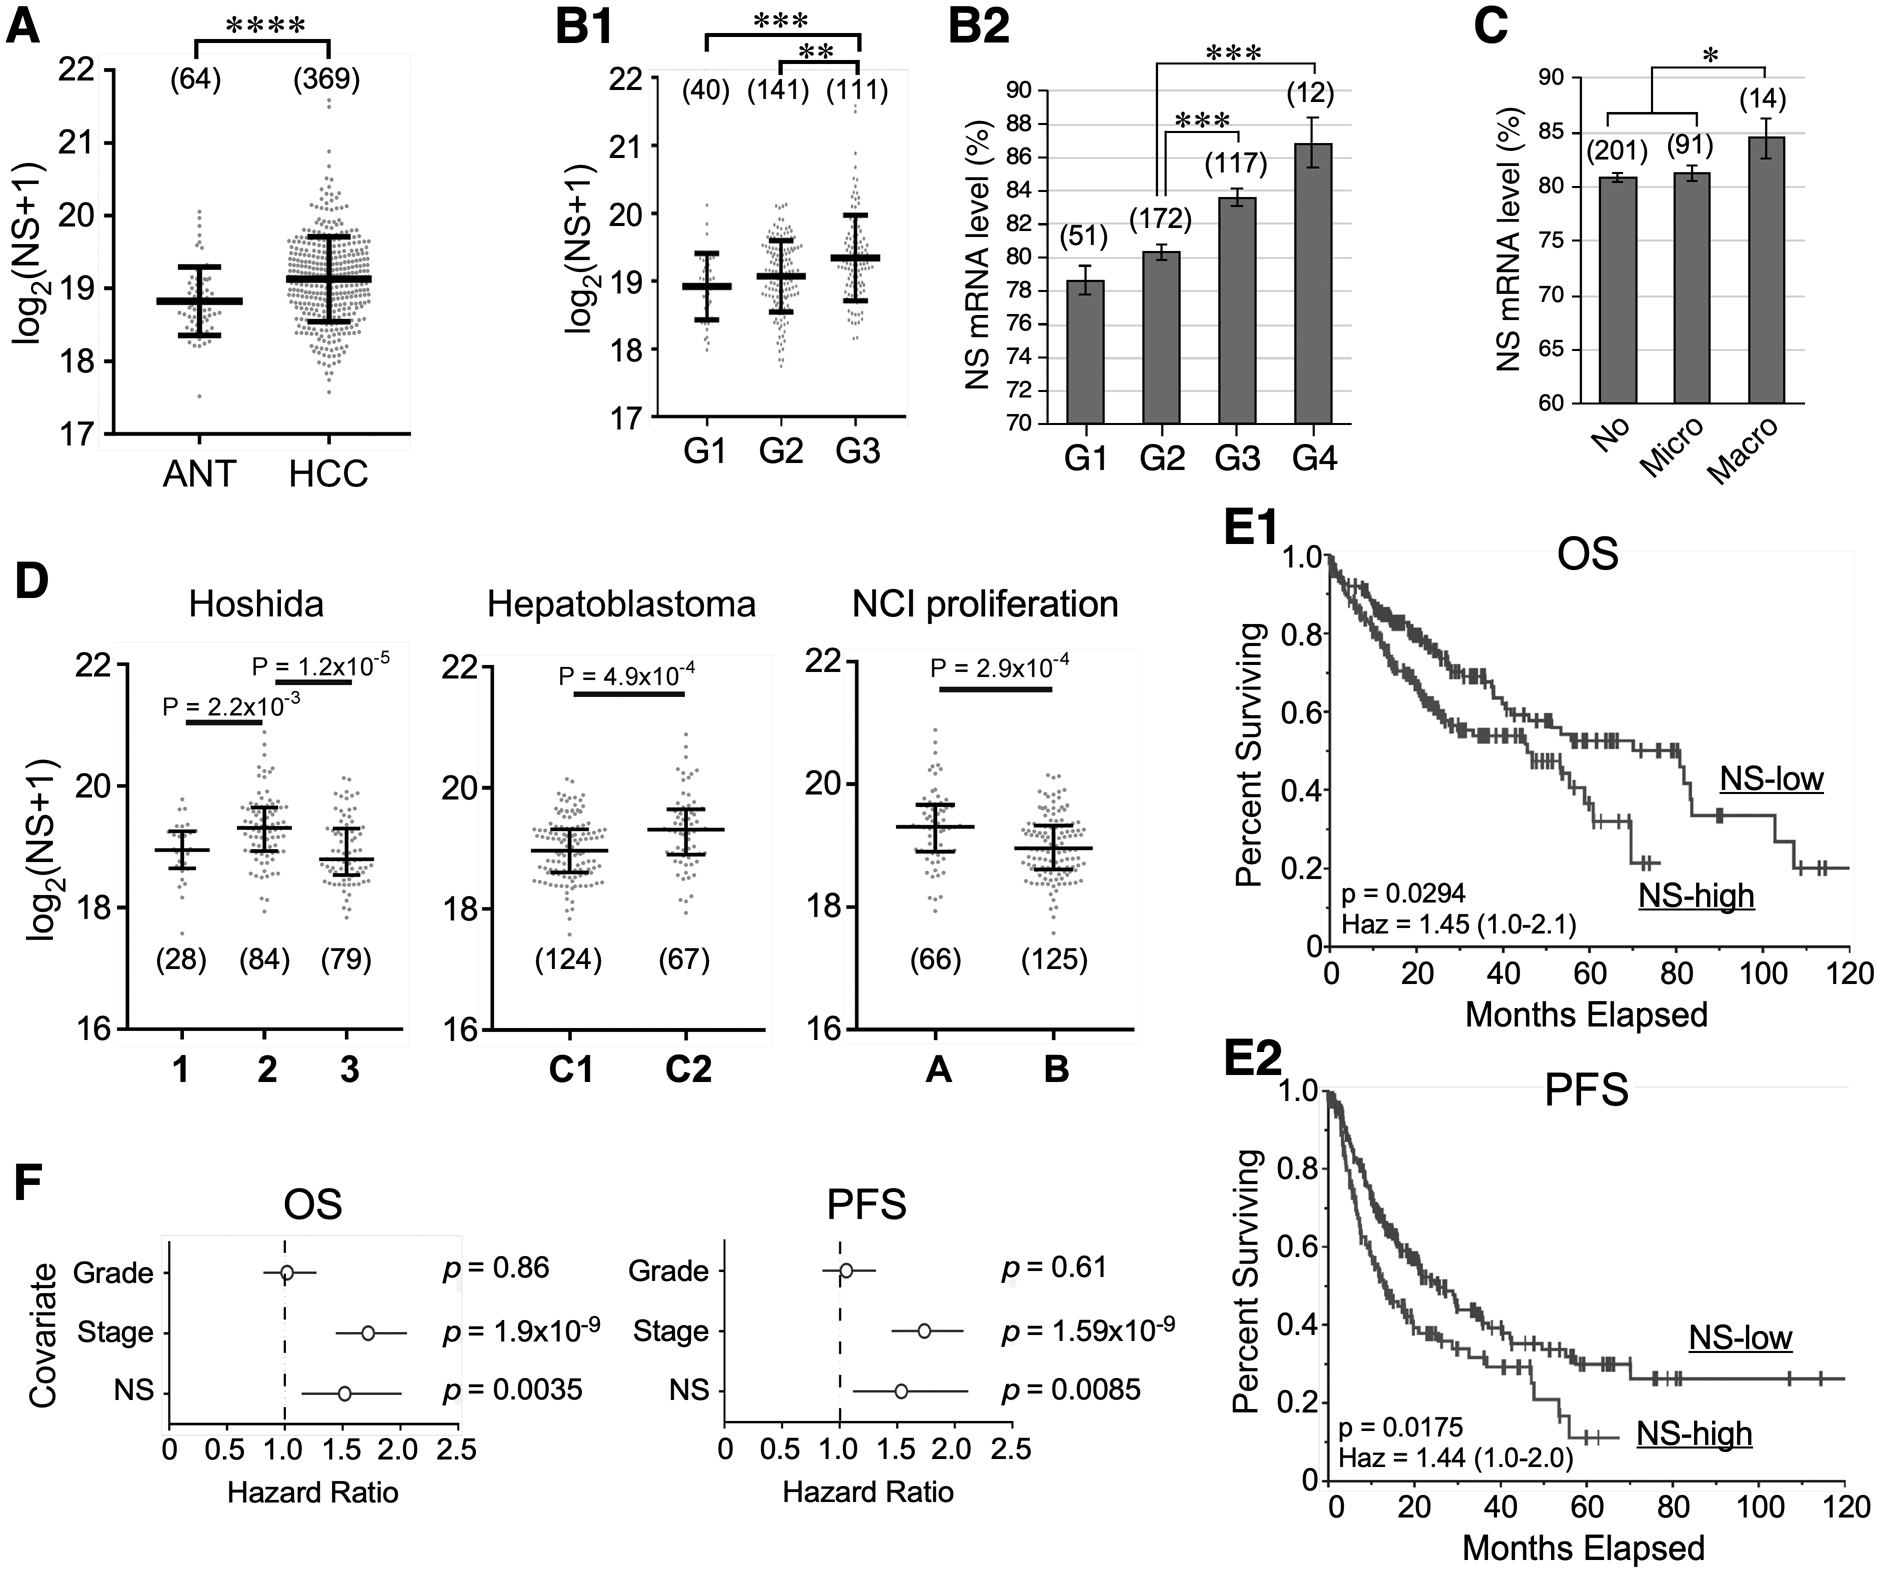
Figure 1.

NS transcript level correlates with tumor grade and predicts survival outcome of hepatocellular carcinoma (HCC). TCGA analyses of RNA-seq-based NS expression in: (A) adjacent nontumor tissue (ANT) and HCC; (B) HCCs of different tumor grades (G) with or without grade 4 (G4); (C) HCCs of different vascular invasion; and (D) different molecular subtypes of HCCs. Statistical significance determined by the Wilcoxon Rank Sum test for two groups, by the Kruskal-Wallis H test followed by the Dunn’s Post Hoc test for ≥3 groups, and by t-test for B2 & C. Whiskers indicate median with interquartile distance. Numbers in parentheses show sample sizes. (E) Univariate analyses of overall survival (OS, E1) and progression-free survival (PFS, E2) of HCC patients with high and low NS expression by the Kaplan Meier plot (n=368). High and low NS are defined by the upper tertile and the remaining two-thirds, respectively. Significance determined by the log-rank (univariate) test. (F) Multivariate OS and PFS analyses of NS, tumor grade, and clinical stage in HCC patients by the Cox proportional hazards model. *, p <0.05; **, p <0.01; ***, p <0.001; ****, p <0.0001; Haz, hazard ratio.
