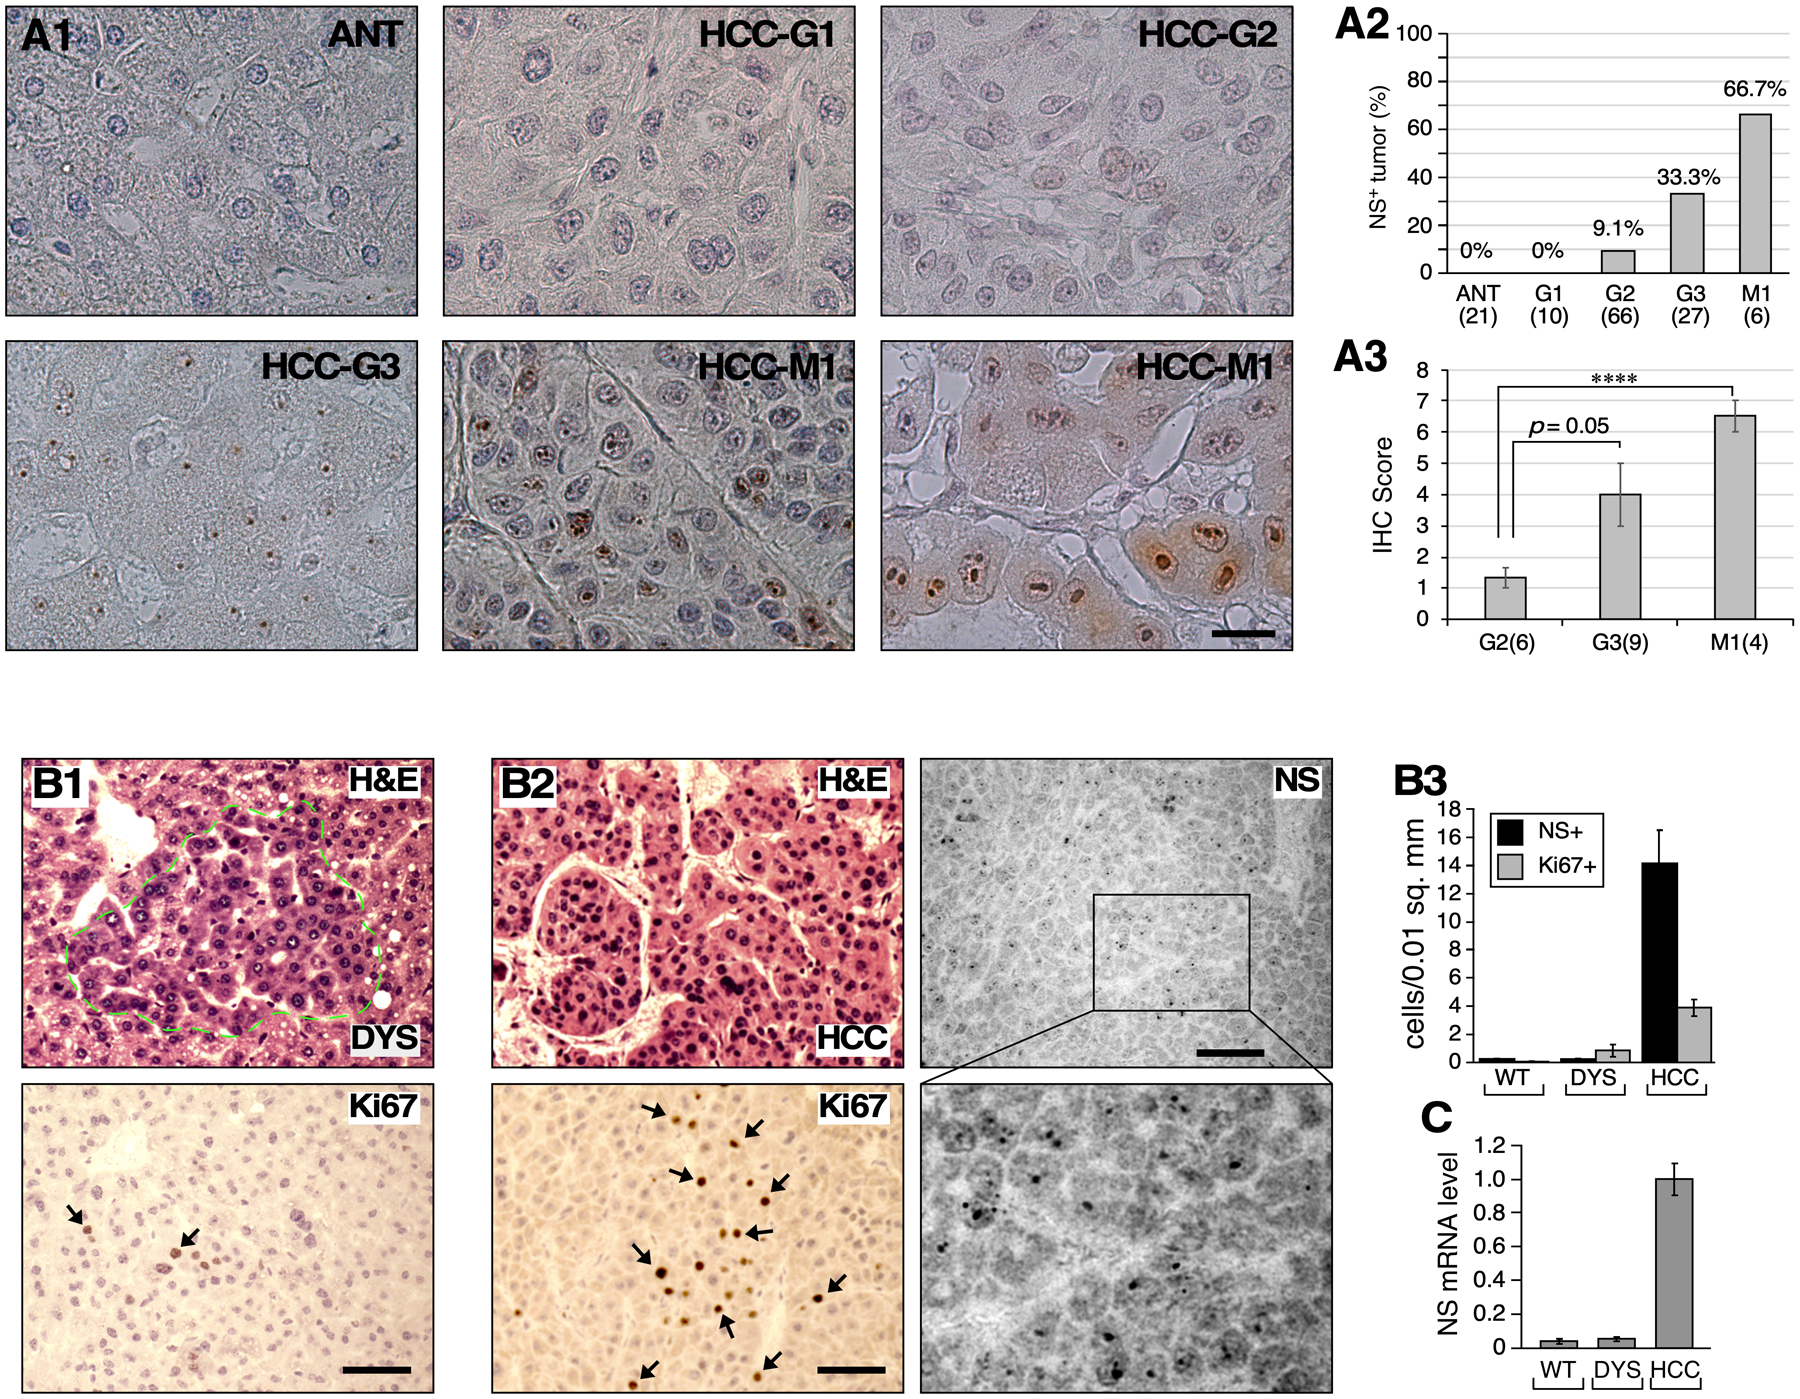
Figure 2.

NS protein expression in high-grade HCC. (A1) Immunohistochemistry of NS (brown) with light hematoxylin counterstain (blue) in human metastasized HCCs (M1) compared to primary HCCs of different grades. (A2) Percentages of NS+ tumors in different HCC grade categories. (A3) IHC scores of NS for NS+ tumors of different grades. Numbers in parentheses indicate tumor case numbers. (B) DEN-induced mouse HCCs collected at 8 months old (m/o) (B1) and 14 m/o (B2) and determined for their pathologies (H&E), mitotic activities (Ki67), and NS+ cells. (B3) Bar graphs show quantification (mean ± sem) of NS+ and Ki67+ cells in liver normal tissue (WT), dysplastic nodules (DYS), and carcinoma (HCC). Y-axis indicates cells per 0.01mm2. (C) NS expression by quantitative RT-PCR. Scale bars, 20μm (A), 50μm (B).
