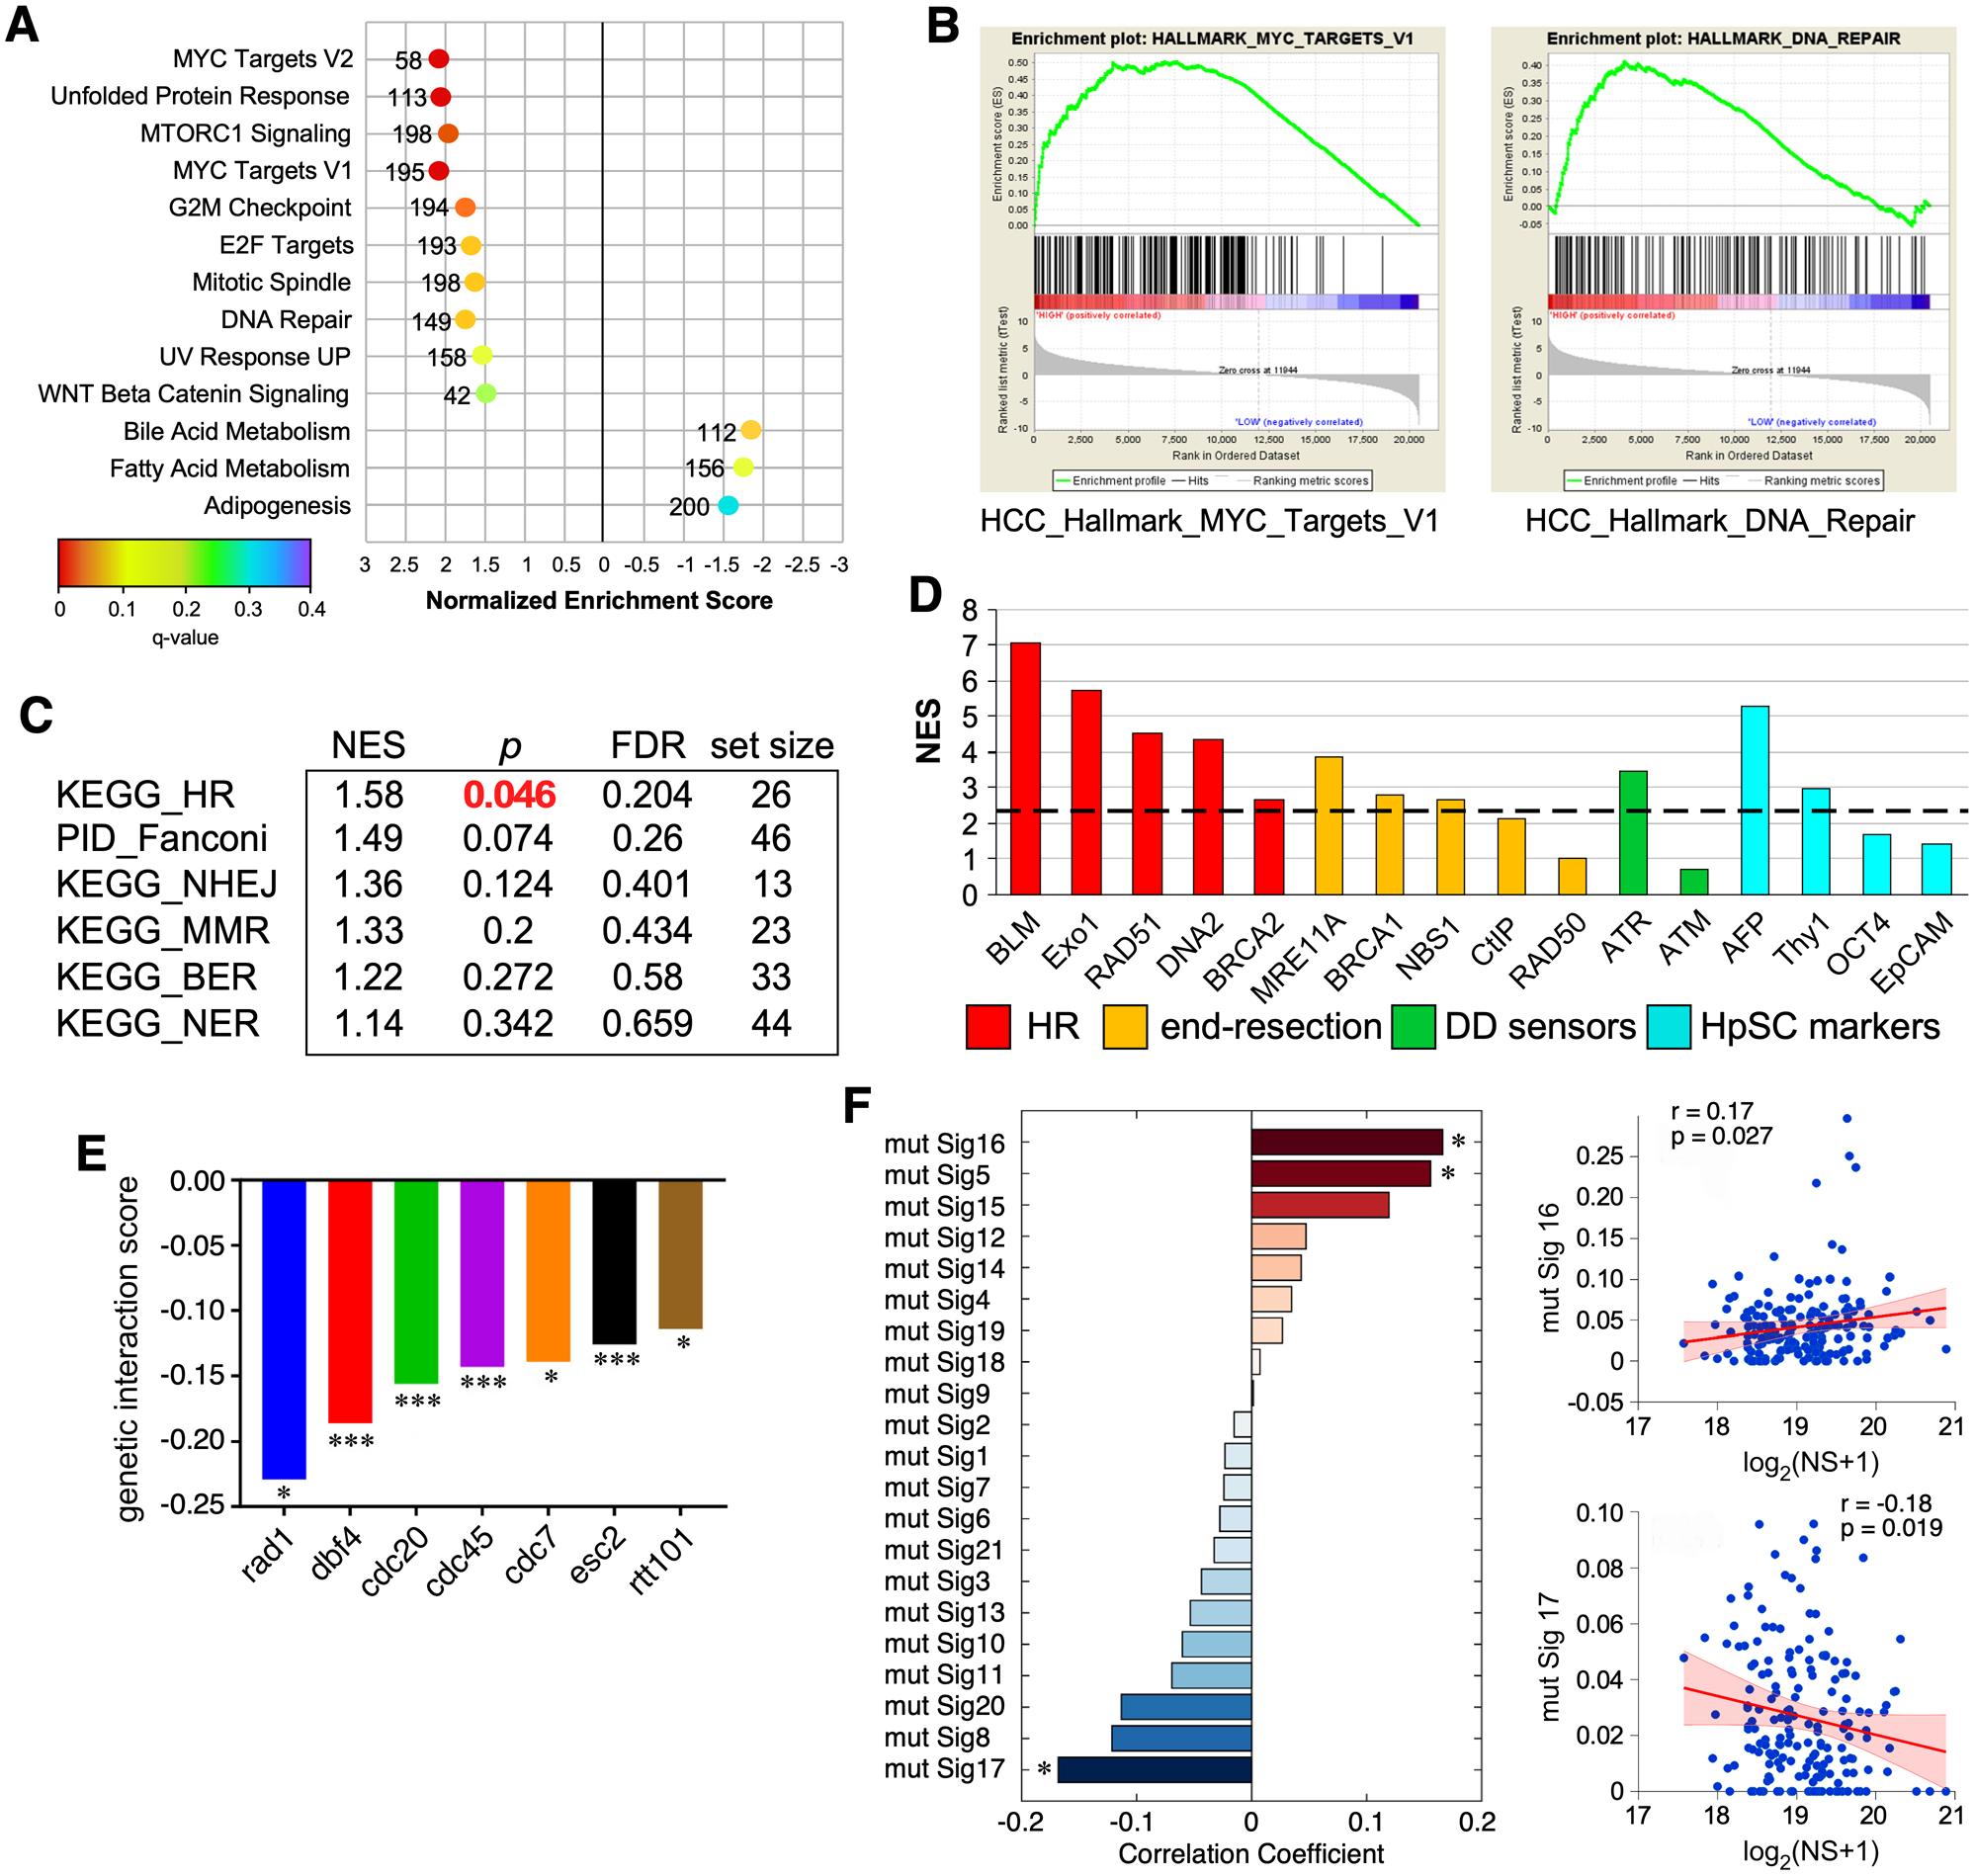
Figure 3.

Genome-wide analysis of NS co-enrichment with pathways and mutational signatures in human HCC samples and its functional intersects in yeast. (A) Top-ranked HALLMARK pathways with positive (NES >1.5) or negative (NES <−1.5) co-enrichment with NS and p values <0.05 by GSEA. X-axis shows NES (−3 to 3); color scheme depicts FDR q values (0 to 0.4); numbers indicate pathway size. (B) Enrichment plots for the MYC Targets (left) and DNA Repair (right) pathways. (C) Canonical pathway analysis of NS co-enrichment with DNA repair sub-pathways in HCC. (D) NS co-enrichment with genes involved in HR repair (red), limited end resection (yellow), DNA damage sensing (green), and hepatic stem cell markers (HpSC, blue) in human HCC. Y-axis shows NES. Genes with NES values above the dashed line show significant correlation with NS, except for Thy1 (see Fig.S2B). (E) Genetic interaction network of Nug1 (NS orthologue) in yeast based on synthetic lethality. (F) Correlation between NS expression and mutational signatures in HCC. ES, enrichment scores; NES, normalized enrichment scores; FDR, false discovery rate.
