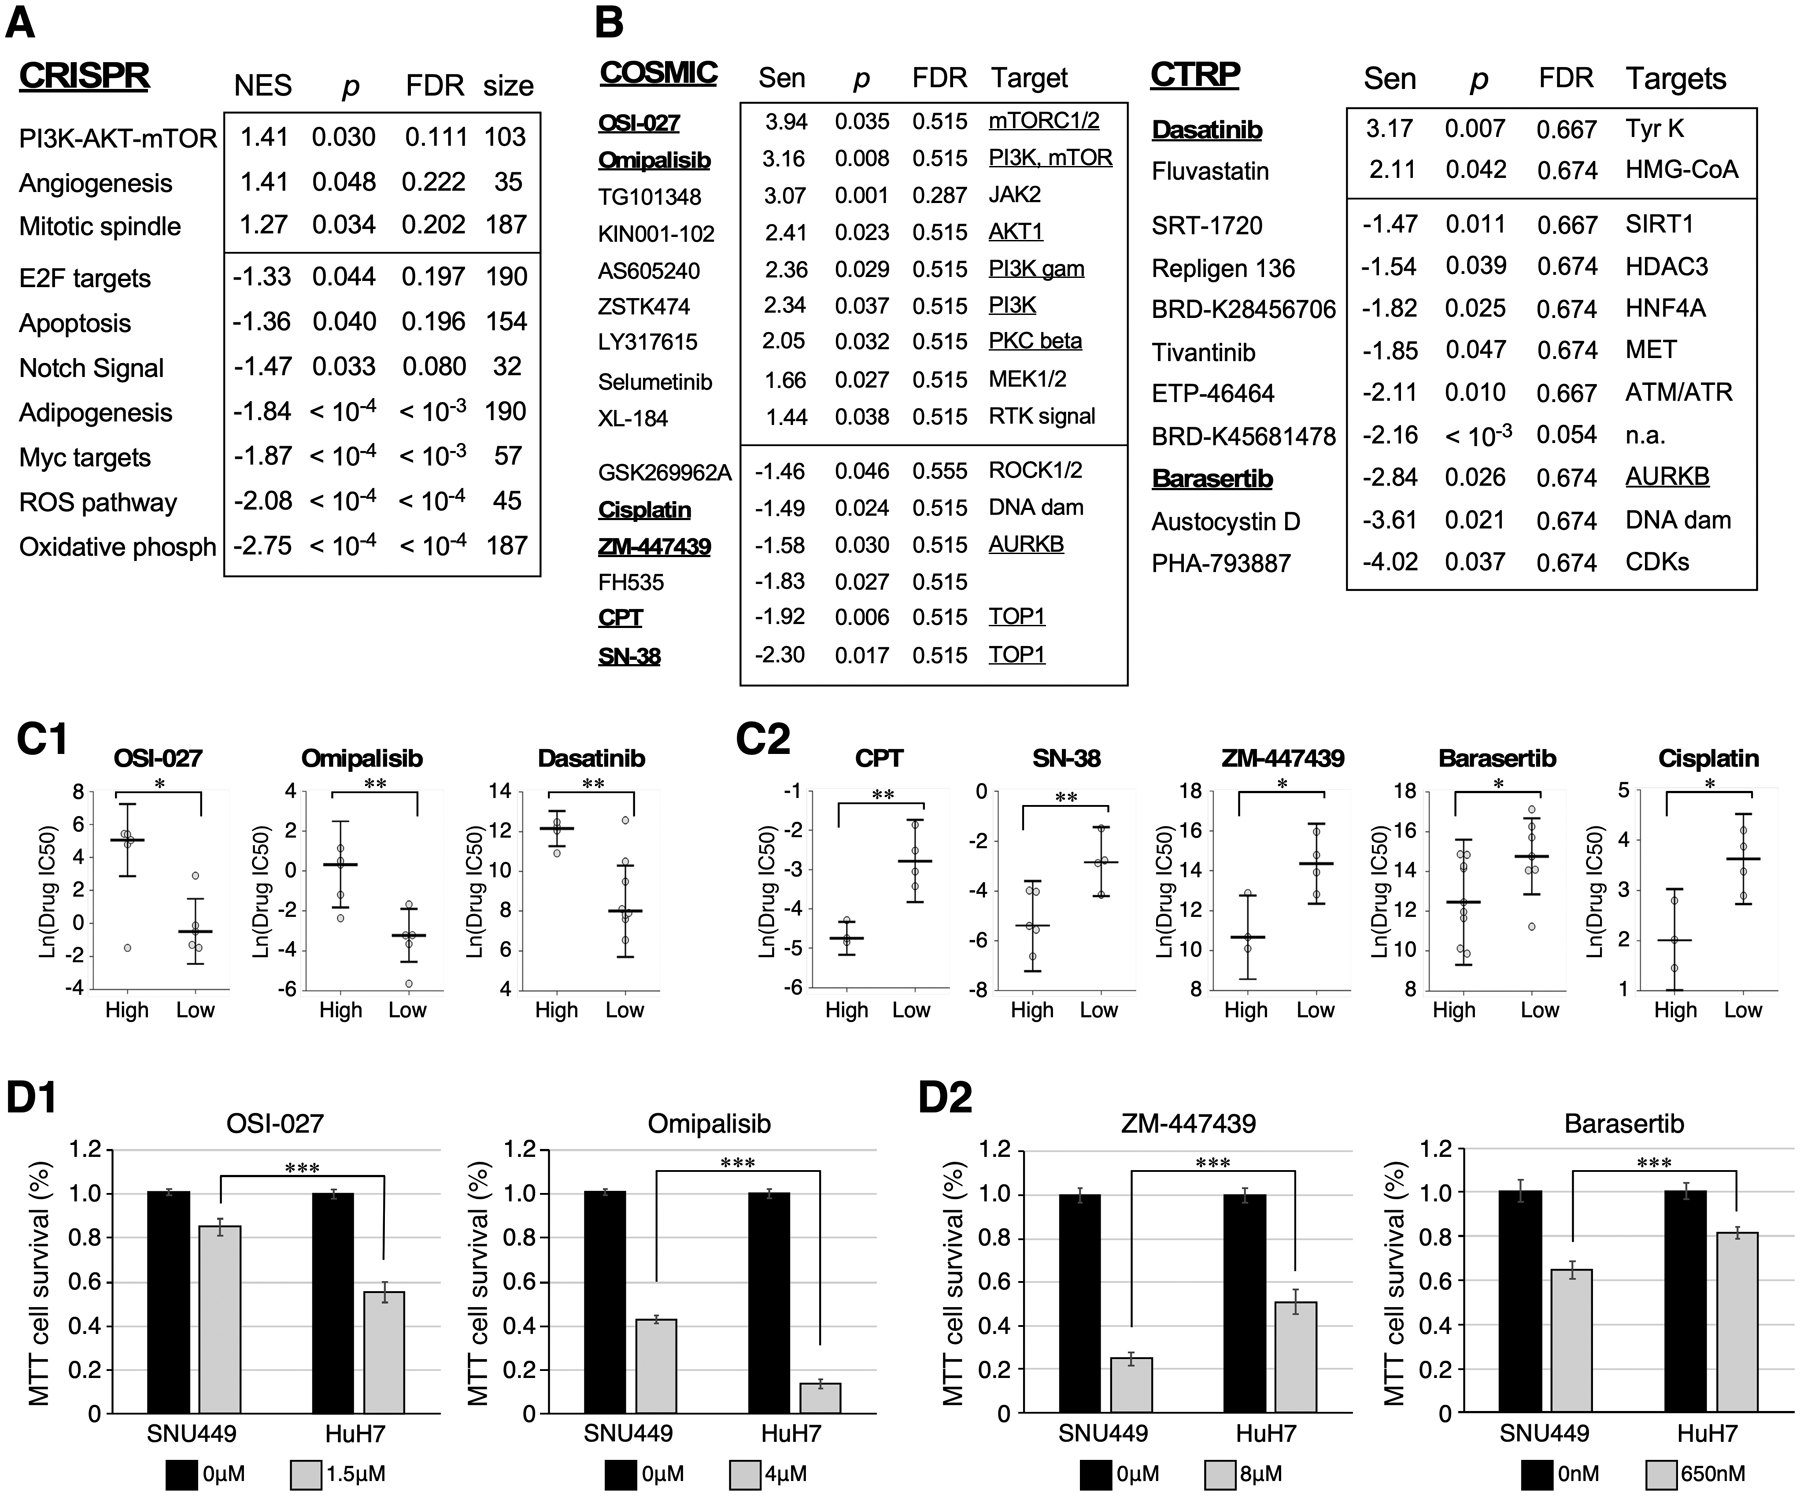
Figure 4.

NS-high and NS-low HCC cells show preferential reliance on different classes of gene knockout and pathway inhibitors. (A) Top-ranked HALLMARK Pathways whose knockout shows synthetic lethality in NS-low (NES>0) or NS-high (NES<0) HCC cells, with p values <0.05 by GSEA. (B) Tables list top-ranked inhibitors from the COSMIC (left) or CTRP (right) panels showing significant synthetic lethality with NS-high (Sen <−1.4) or NS-low (Sen >1.4) HCC cells, with p values <0.05. (C) Relative viability of NS-high and NS-low HCC cells following treatment of specific inhibitors underlined in 4B. (D) MTT-based cell survival assays of SNU449 (NS-high) and HuH7 (NS-low) cells treated with mTOR inhibitors (D1, OSI-027, omipalisib) and AURKB inhibitors (D2, ZM-447439, Baraserib). Y-axis shows percentages of surviving cells following drug treatment compared to non-treated controls. Data consist of four biological repeats with three technical triplicates.
