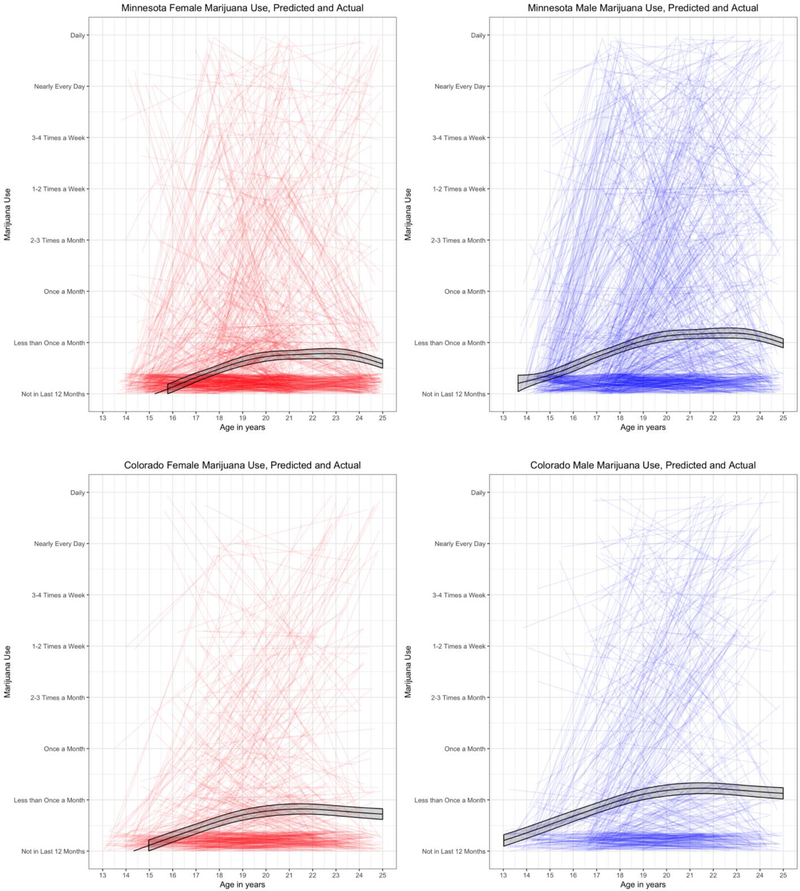
Figure 2.
Raw change in marijuana use (substantially jittered to prevent overplotting), split by sex (red/left is female and blue/right is male) and by state. Black lines are predicted mean marijuana use over time predicted via a generalized additive mixture model in each state. The shaded ribbon represents the 95% confidence interval around the predicted mean trajectory. Data from the Minnesota sample is truncated at age 25 in order to provide a more direct comparison to the Colorado sample.

