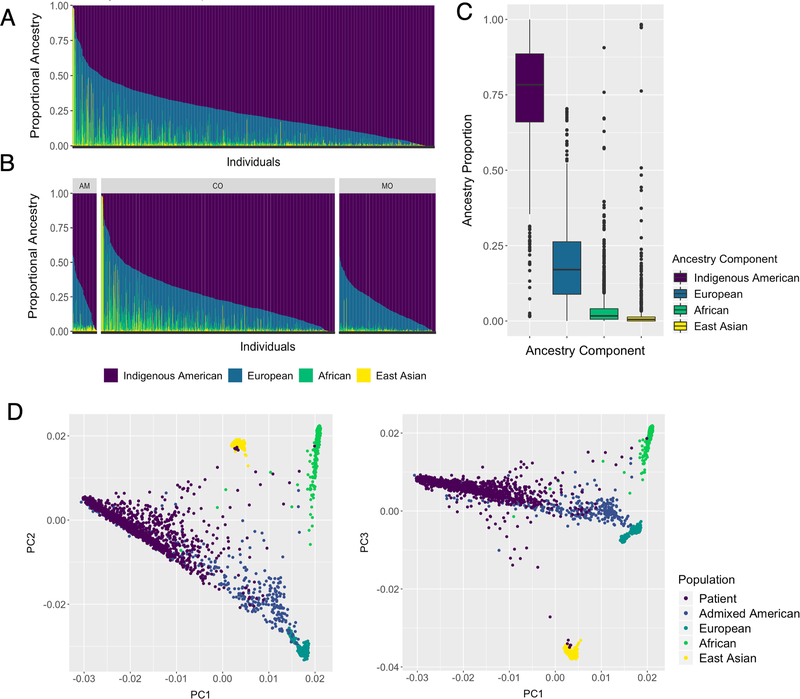
Figure 1:
Population structure of 1,312 Peruvian breast cancer patients. A and B) ADMIXTURE clustering analysis using unsupervised models assuming K = 4 for all patients and by region of birth, respectively. AM= Amazonian, CO= Coastal, MO= Mountain. C) Boxplots show the distribution of each ancestry component. Median ancestry value is represented as a solid line, interquartile range [IQR] as a box, and whiskers extend up to 1.5*IQR. Potential outliers are depicted as solid points. D) PCA including the PEGEN-BC study patients and 1000G samples. PC1, PCA2 and PC3: first three principal components.

