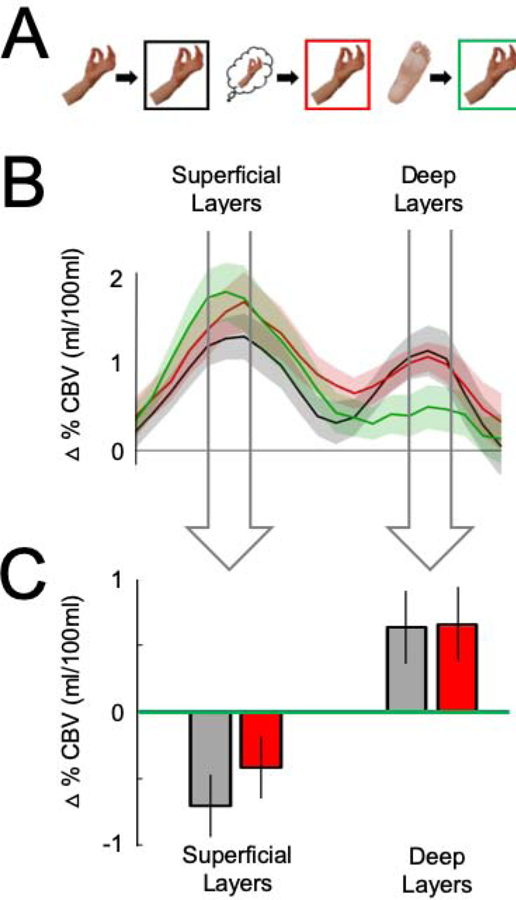
Figure 3. Layer-specific repetition suppression and enhancement effects in M1.

(A) In the graphs that follow, the responses to Tapping are separated by the type of trial that preceded it: Tapping preceded by Tapping is plotted in black, Tapping preceded by Imagined tapping in red, and Tapping preceded by Toe wiggling in green. (B) The VASO responses to Tapping across cortical layers, separated by which trial type preceded it. The widths of the arrows correspond to functional windows that comprise the peak and the data point on either side of it in the functionally defined superficial and deep layers, respectively. (C) The data in the bar graph are the same data shown in 3B, averaged across the functional window in the superficial and deep layers, respectively, in each participant. The data are plotted as difference scores – i.e. Tapping-preceded-by-toe-wiggling minus Tapping-preceded-by-tapping and Tapping-preceded-by-toe-wiggling minus Tapping-preceded-by-imagined tapping – in the superficial and deep layers. The responses to Tapping were attenuated both when it was preceded by Tapping and when it was preceded by Imagined tapping, relative to when Tapping was preceded by Toe wiggling (i.e., repetition suppression) in the superficial layers. By contrast, the responses to Tapping were enhanced both when it was preceded by Tapping and when it was preceded by Imagined tapping, relative to when Tapping was preceded by Toe wiggling (i.e., repetition enhancement) in the deep layers. Error bars on the line plots represent +/− 1 SEM. Error bars on the bar graphs are 95% within-subject confidence intervals.
