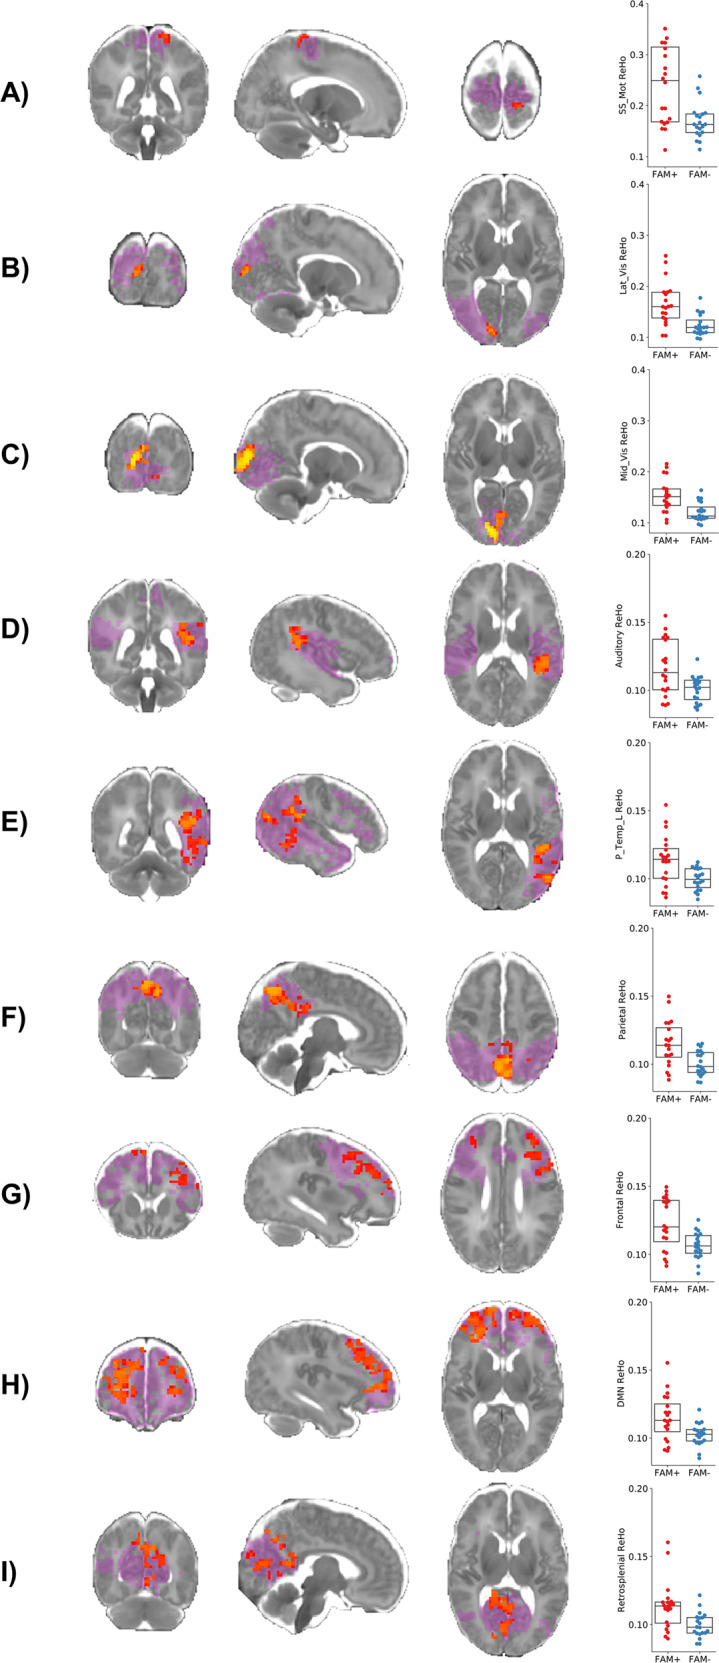
Fig. 3. Local functional connectivity differences between FAM+ and FAM− sample.

The binarized mask of each resting state network (lilac) is overlaid on a T2 weighted 42 PMA week template. The results of a non-parametric t-test comparing ReHo Fisher z-scores between groups are depicted in red-yellow. The somatosensory/motor, lateral visual, mid visual, auditory, left posterior temporal, parietal, frontal, DMN and retrosplenial RSNs showed extensive clusters of significantly higher ReHo in the FAM+ sample after false discovery rate (FDR) correction.
