
Fig. 7.
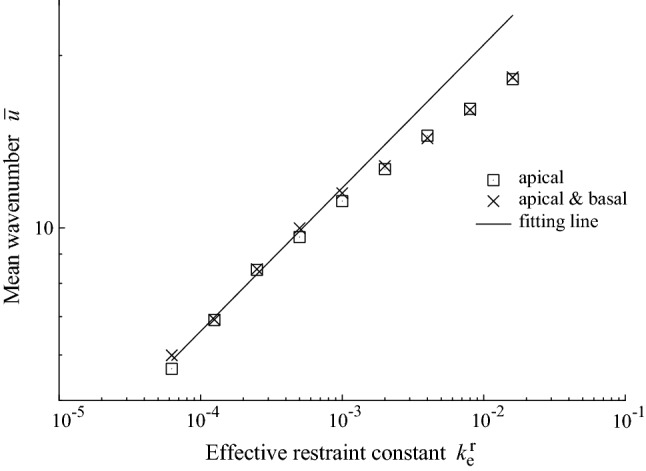
Relationship between the mean wavenumber and restraint constant. The legend gives the confinement side. The effective restraint constant, , is the sum of the apical and basal restraint constants. The line shows the least-squares fitting line for small wavenumbers (): . Simulation results are obtained for the longest axis of cell division