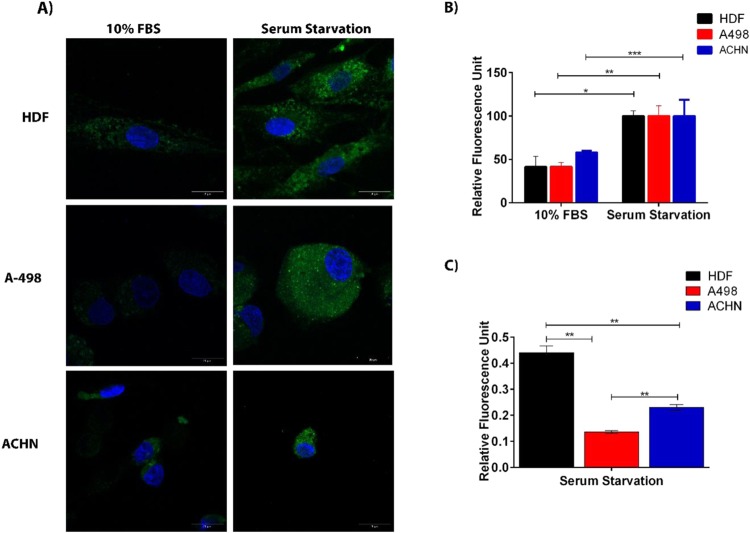
Figure 5.
Detection of serum starvation-induced carbonylation in HDF, A498 and ACHN cells. Cells were incubated with and without 10 percent FBS in DMEM for 16 hours. While A498 cells were labeled with 20 µM, ACHN and HDF cells were labeled with 15 µM 2Hzin5NP for 30 minutes. (A) Representative images from there independent experiments were captured using Zeiss LSM 800 confocal microscope at 40x objective. 405 nm and 488 nm diode lasers were used for excitation and LP 435 and 518 filters were used for the emission. Scale bar is equal to 10 µm. (B) Quantitative analysis of carbonylation levels in HDF, A498 and ACHN cells using Varioskan Multimode Plate Reader. Cell lysates obtained by six freeze-thaw cycles in lysis buffer were analyzed by measuring fluorescence intensity (RFU) at 396 nm excitation and 506 nm emission. The autofluorescence intensity of control groups was respectively subtracted from all experimental groups. Each data point represents average of at least three independent experiments. The percentage of RFU obtained for each 2Hzin5NP labeled cell line in the serum free conditions was set to 100%. (C) Detection of carbonylation levels in HDF, A498 and ACHN cells in response to serum starvation. Each data point corresponds to average RFU from three independent experiments. *P ≤ 0.05, **P ≤ 0.01, ***P ≤ 0.001).

