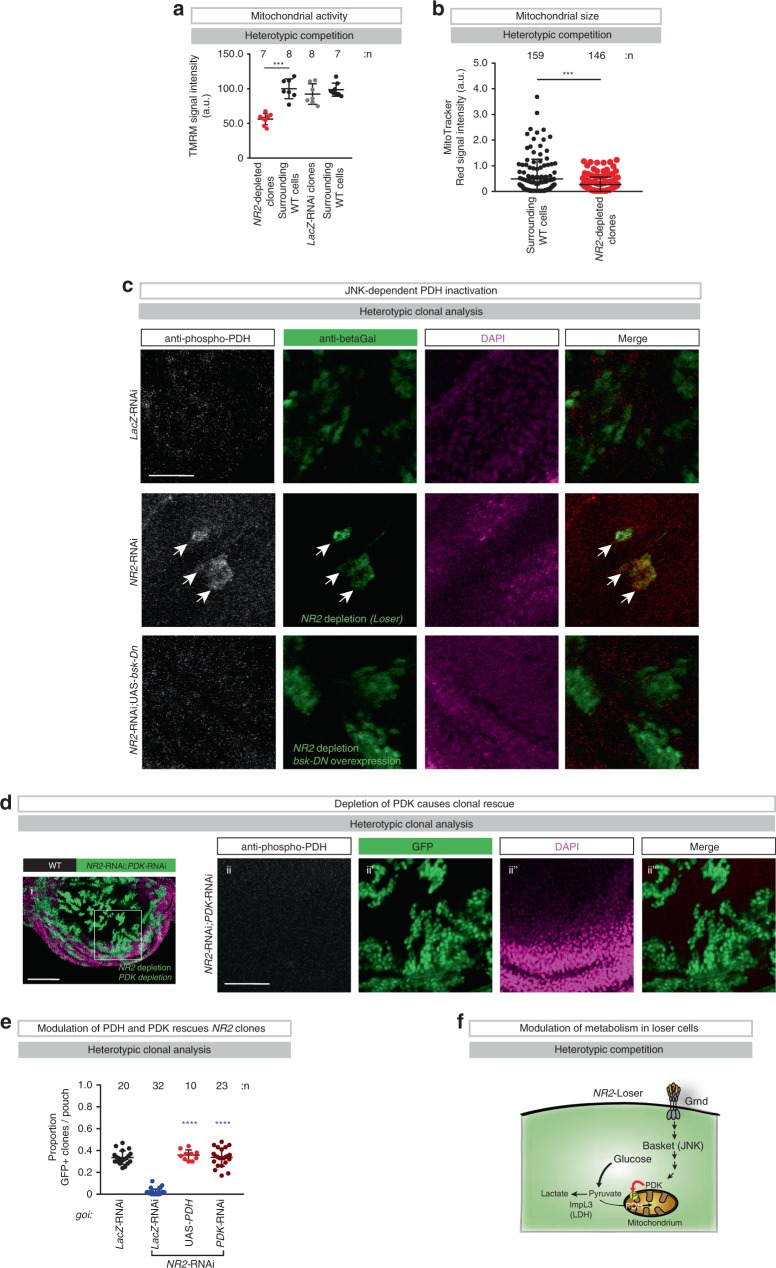
Fig. 3. The TNF>JNK>PDK>PDH signalling axis reprograms the metabolism of NR2 loser clones.
a Quantification of the heterotypic competition assay. Diagram shows the average signal intensity of TMRM staining in RNAi clones and immediately adjacent wild-type cells per wing pouch ± SD. ****P < 0.0001, ***P < 0.001, **P < 0.01, *P < 0.1 by two-tailed Mann–Whitney nonparametric U-test. WT surrounding vs. NR2-RNAi clones ***P value: 0.0003). n depicts the number of cells. See Supplementary Data Table for genotypes. b Quantification of the heterotypic competition assay. Diagram shows the average signal intensity of MitoTracker Red staining in RNAi clones and immediately adjacent wild-type cells per wing pouch ± SD. ****P < 0.0001, ***P < 0.001, **P < 0.01, *P < 0.1 by two-tailed Mann–Whitney nonparametric U-test. (NR2-RNAi vs. WT P value: ***0.0007). n depicts the number of cells. See Supplementary Data Table for genotypes. c Phospho-PDH-specific immunostaining of clones expressing genes-of-interest (goi) and UAS-LacZ. LacZ expression is revealed by anti-βGal staining. Scale bar 25 μm. Experiments were repeated three independent times. d Heterotypic clonal analysis. The indicated gene-of-interest (goi) was knocked down (UAS-PDK-RNAi) in GFP-marked NR2-RNAi clones, and stained for anti-phospho-PDH (ii). Clones are marked by GFP (green). Scale bar 100 μm (i) or 50 μm (ii). e Quantification of the heterotypic competition assay. Diagram (error bars) shows the average occupancy of the indicated RNAi clones per wing pouch ± SD. ****P < 0.0001, ***P < 0.001, **P < 0.01, *P < 0.1 by two-tailed Mann–Whitney nonparametric U-test. n depicts the number of wing discs. Experiments were repeated four independent times. See Supplementary Data Table for genotypes. f Schematic representation of the metabolic reprograming of loser cells by the TNF>JNK>PDK>PDH signalling pathway.

