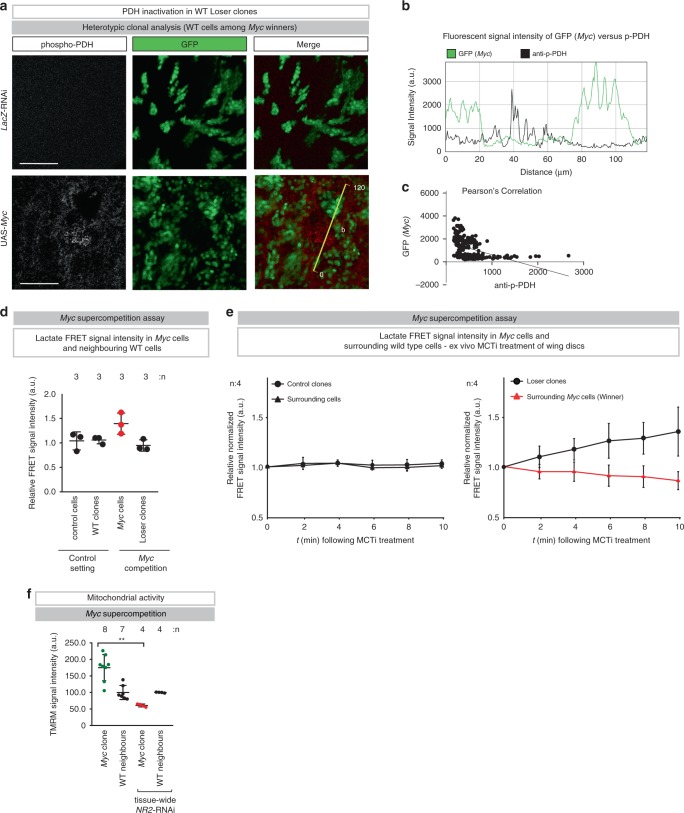
Fig. 6. Lactate-mediated metabolic coupling occurs during loser and Myc supercompetition.
a Confocal images of dissected wing pouches stained for anti-phospho-PDH (reading out its inactivation). Scale bar 50 μm. Experiments were repeated three independent times. b Fluorescent intensities of phospho-PDH (black) and GFP (green) are measured by ImageJ software at the yellow line. c Pearson’s correlation analysis of phospho-PDH and GFP. d, e Heterotypic clonal analysis. Relative normalized lactate FRET signal intensity of clonal cells and surrounding cells of the wing pouch was monitored for 10 min following the administration of MCT inhibitor, ex vivo. See Supplementary Table 1 for genotypes. f Quantification of the heterotypic competition assay. Diagram (error bars) shows the average signal intensity of TMRM staining in UAS-Myc clones and immediately adjacent wild-type cells per wing pouch ± SD. ****P < 0.0001, ***P < 0.001, **P < 0.01, *P < 0.1 by two-tailed Mann–Whitney nonparametric U-test. (UAS-Myc clone with tissue-wide NR2-RNAi vs. UAS-Myc clone on control P value: 0.004). n depicts the number of wing discs. See Supplementary Table 1 for genotypes.

