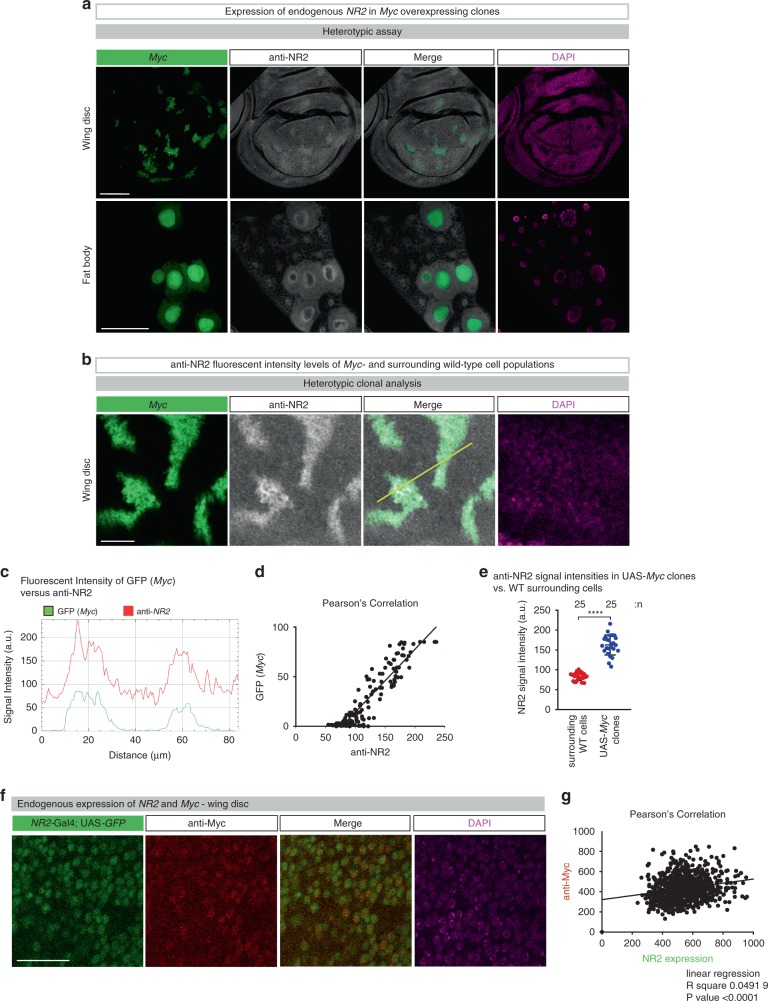
Fig. 7. NR2 is upregulated in supercompetitior Myc-expressing cells.
a, b Immunostaining of imaginal wing discs and fat body, GFP-marked Myc over-expressing clones. NR2 expression is revealed by antibody specific to the Drosophila NR2 subunit. Scale bars 100 and 25 μm, respectively. Experiments were repeated three independent times. c Fluorescent intensities of anti-NR2 (red) and GFP (Myc, green) are measured by ImageJ software at the yellow line. d Pearson’s correlation analysis of anti-NR2 and GFP (Myc). e Mean signal intensities (error bars) of anti-NR2 specific staining in Myc expressing cells (blue) and immediately adjacent wild-type cells (red) ± SD. ****P < 0.0001, ***P < 0.001, **P < 0.01, *P < 0.1 by two-tailed Mann–Whitney nonparametric U-test. f Endogenous expression levels of NR2 (followed by GFP) and Myc (anti-Myc immunostaining). Scale bar 20 μm. Experiments were repeated two independent times. g Pearson’s correlation analysis of NR2 (GFP) and Myc (anti-Myc).

