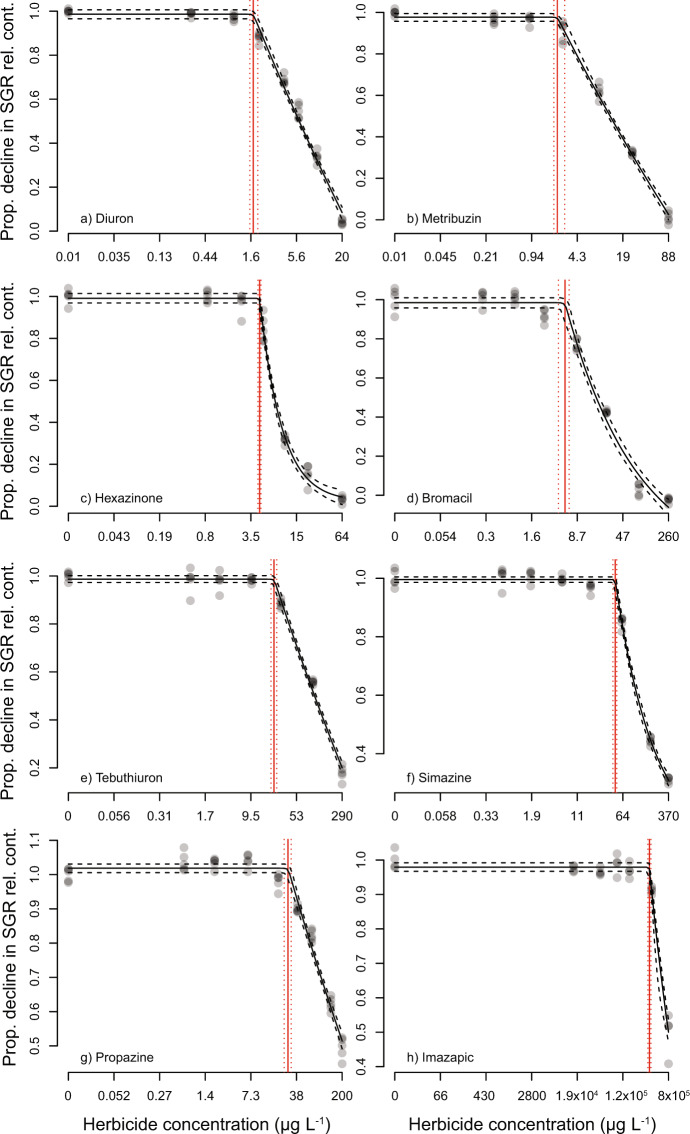
Figure 2.
Concentration-response curves for NEC derivation. Bayesian non-linear gaussian model fit on the proportional decline in 3-day specific growth rate (SGR) relative to the control treatment (solid black line) and 95% confidence interval (black dashed line) to derive the no effect concentration (NEC) (red line) and 95% confidence interval (red dashed line) of (a) diuron; (b) metribuzin; (c) hexazinone; (d) bromacil; (e) tebuthiuron; (f) simazine; (g) propazine; and h) imazapic. All concentrations in µg L−1.

