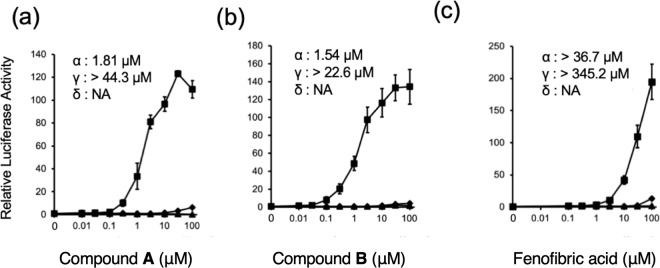
Figure 2.
Transcriptional activation of hPPAR subtypes in GAL4 chimeric receptor assay by compounds: PPARα (square), PPARγ (circle), and PPARβ/δ (triangle). Cells were treated with various concentrations of compound A (a), compound B (b), or fenofibric acid (c). Values are expressed as fold-induction of the vehicle set as 1. Estimated EC50 values for subtypes are shown on each plot. For all graphs, error bars indicate the mean ± SE of three or four independent measurements.

