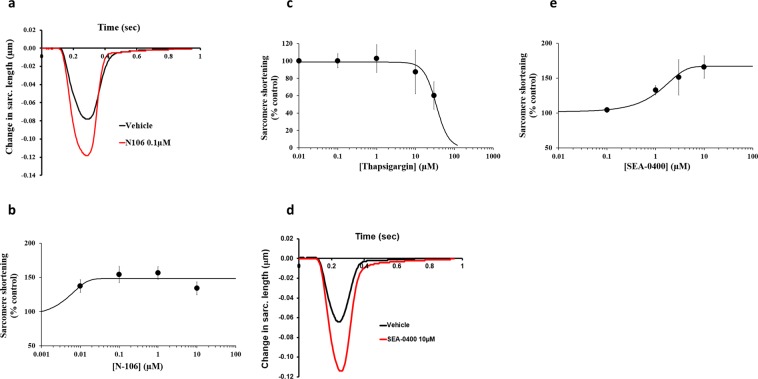
Figure 2.
Effects of N-106, Thapsigargin and SEA-0400 on human cardiomyocyte contractility. (a) Typical contractility transients recorded from an adult human primary ventricular myocyte in the presence of vehicle control and after exposure to N106 at 0.1 µM. (b,c) C-E curves generated with N-106 and Thapsigargin, respectively. (d) Typical contractility transients recorded from an adult human primary ventricular myocyte in the presence of vehicle control and after exposure to SEA-0400 at 10 µM. (e) C-E curve generated with SEA-0400. Each C-E curve plot shows the effect of a test article on sarcomere shortening as well as the mean data points and the fitted C-E curve. IonWizard software (v1.2.22, www.ionoptix.com) and SigmaPlot v14.0 (www.systatsoftware.com) were used to generate the representative contractility transients and fitted C-E curves, respectively.

