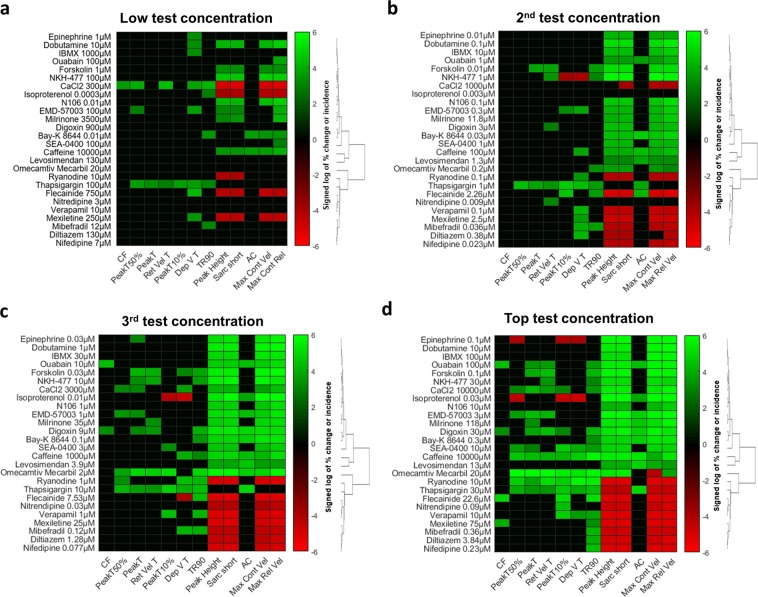
Figure 5.
Classification of subsets of both positives as well as negative inotropes, in a mechanism-related mode after exposure to low (a), 2nd (b), 3rd (c) and top (d) test concentrations. Right-skewed percentage data of incidence (AC and CF) and change (all other contractility parameters) were normalized with a signed log transformation. Heatmap representations were created with a cluster analysis using dendrograms and partitions given the elbow criterion. Red and green colors indicate decrease and increase of >25% and >10% change, respectively. Black color indicate no effect (<−25% <% change <10%).

