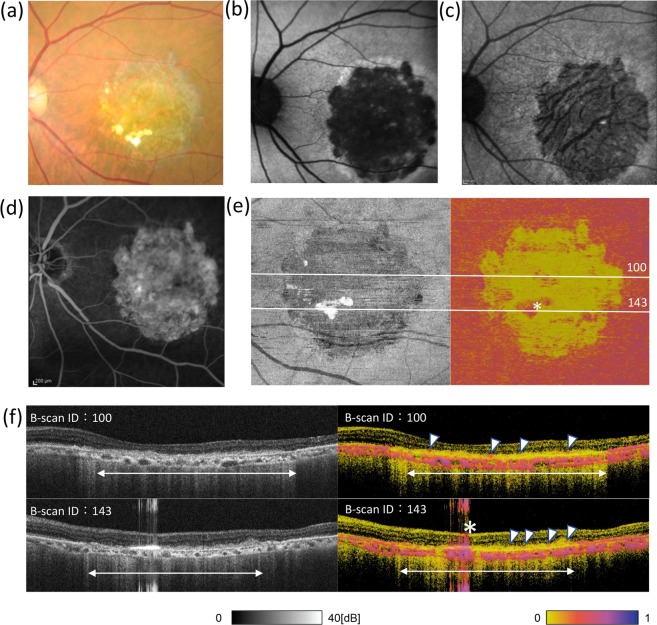
Figure 3.
Ophthalmologic and PS-OCT images of the left eye of a patient with AMD. Colour fundus photograph (a), fundus autofluorescence (AF) images (b,c), and fluorescein angiography image (d) of the left eye of a patient with dry age-related macular degeneration. AF images were taken at 532 (b) and 787 (c) nm. Polarization-sensitive optical coherence tomography intensity (left) and en face entropy (right) map excluding the effect of choroidal melanin (e), as described in Methods, and cross-sectional B-scan images (f) of the left eye of the patient. In (e,f), asterisk indicates a signal artefact; arrowheads indicate the possible presence of melanin-containing retinal pigment epithelial cells, showing high entropy on the surface of sub-retinal hyper-reflective mass; double arrows indicate the atrophy area.

