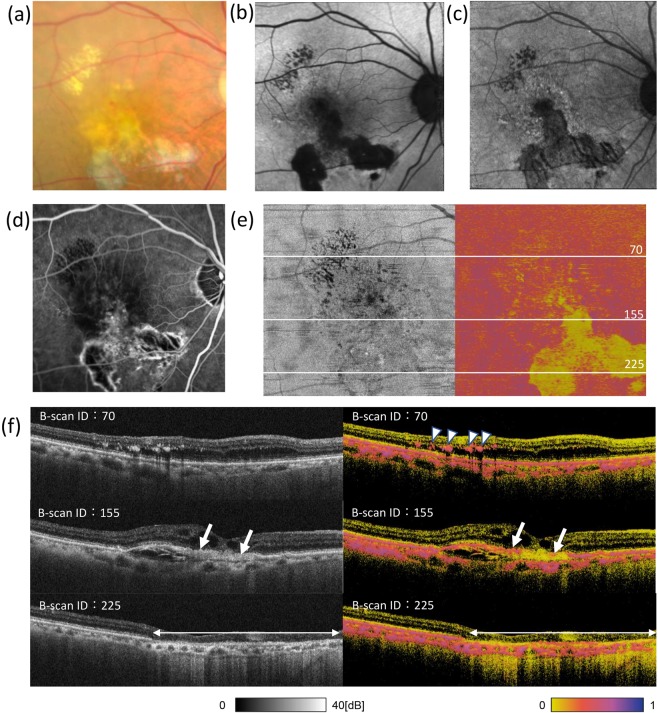
Figure 4.
Ophthalmologic and PS-OCT images of the right eye in the same patient as in Fig. 3. Colour fundus photograph (a), fundus autofluorescence (AF) images (b, c), and fluorescein angiography image (d) of the right eye of a patient with dry age-related macular degeneration. AF images were taken at 532 (b) and 787 (c) nm. Polarization-sensitive optical coherence tomography intensity (left) and en face entropy (right) map (e), excluding the effect of choroidal melanin, as described in Methods, and cross-sectional B-scan images (f) at the lines shown in Fig. 4e. In (f), arrowheads indicate intraretinal hard exudate; arrows indicate blurred retinal pigment epithelial lines in the intensity image; double arrow indicates the atrophy area.

