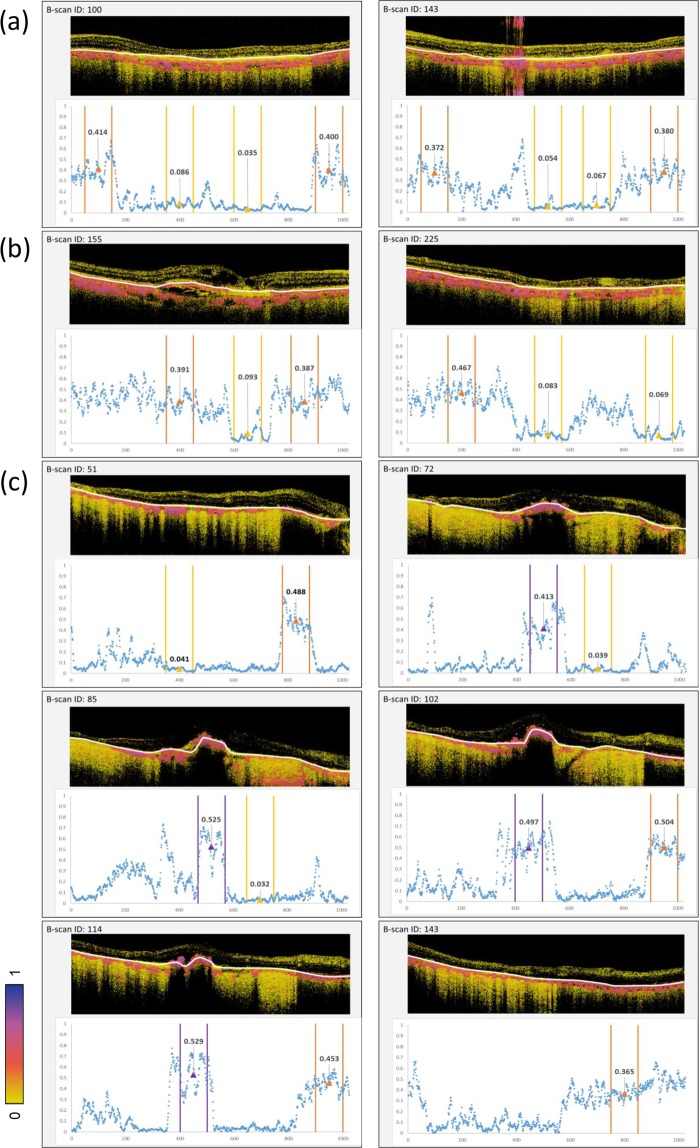
Figure 6.
Quantitative evaluation of entropy of RPEs of diseased, healthy, and hiPSC-RPE sheet in-vivo. Quantitative evaluation of entropy-related cross-sectional B-scan images from the patient retinas presented in Figs. 3–5. Entropy B-scan images and entropy plot for the left (a) and right (b) eyes of a patient with dry age-related macular degeneration and for the eye with transplanted autologous human induced pluripotent stem cell-derived retinal pigment epithelial (hiPSC-PRE) cell sheet (c). Orange, yellow, and purple ranges in the graph mean the intact RPE, atrophic or defective RPE, and hiPSC-RPE areas, respectively. Mean entropy values are shown as triangles. Measurement area of 100 (width) × 3 (depth) pixels is shown by white lines in B-scan entropy images.

