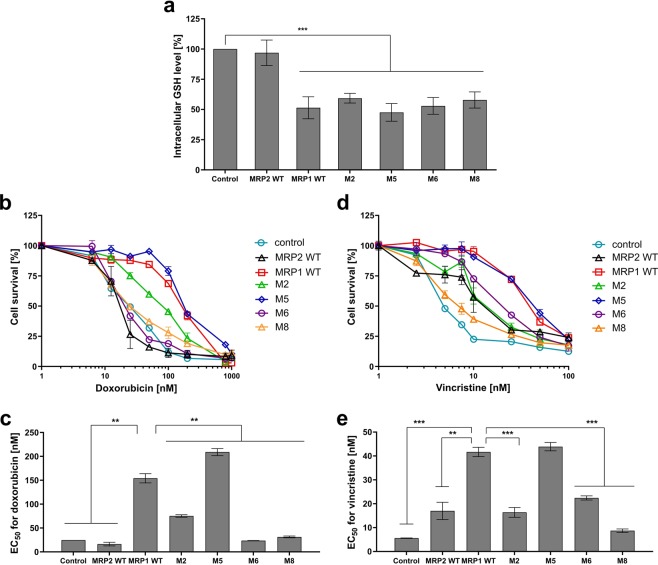
Figure 2.
Functionality of MRP1, MRP2 and the different chimera expressed in FlpIn 293 cell line. (a) Basal GSH efflux: total intracellular GSH contents were quantified in respect of the same cells transfected with the empty vector (Control, 100%). (b-e) MDR phenotype: doxorubicin (b,c) and vincristine cytotoxicity (d,e) in cells expressing, or not, the different proteins. EC50 values are concentrations at which doxorubicin (c) and vincristine (e) kill 50% of the cell population. Data are the means ± SD of triplicate determinations of N ≥ 3 biologically independent assays. **p ≤ 0.01 and ***p ≤ 0.001 based on a two-tailed paired t test.

