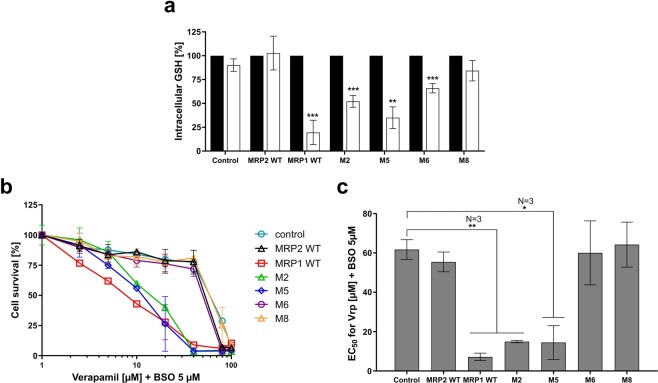
Figure 3.
Characterization of collateral sensitivity dependent on MRP1, MRP2, M2, M5, M6 and M8 chimeras. (a) Quantification of total intracellular GSH contents in cells in the presence of DMSO (black bars) or verapamil (white bars), in respect of the same cells treated with DMSO as a control (DMSO 100%). (b,c) CS evaluation after a 72-h incubation with verapamil, in the presence of 5 µM of L-BSO. EC50 values are concentrations at which verapamil in presence of L-BSO at 5 µM kill 50% of the cell population. Data are the means ± SD of triplicate determinations of three independent assays. *p ≤ 0,05, **p ≤ 0.01 and ***p ≤ 0.001 (two-tailed paired t test).

