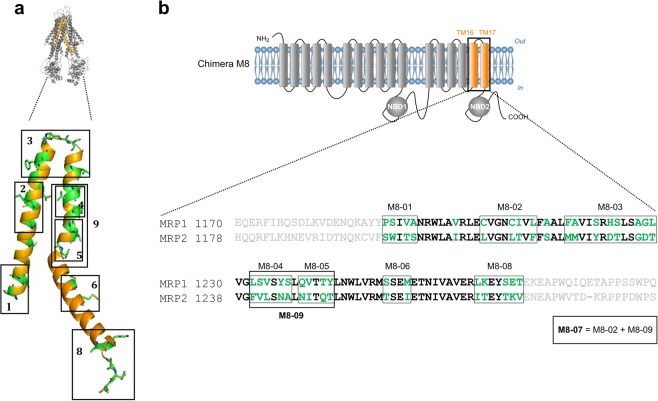
Figure 4.
Processing chimera M8 mutants. (a) Cartoon representation of MRP1 model based on Na-ATM1 3D structure. The orange colored region represents the MRP2 fragment in the chimera M8. MRP2 residues that differ from MRP1 residues are colored in green. The mutants are shown in black boxes. (b) Amino acid alignment of MRP1 and MRP2 in the modified region of chimera M8 (represented in bold). MRP2 residues that differ from MRP1 residues are colored in green. All nine mutants are shown in black boxes.

