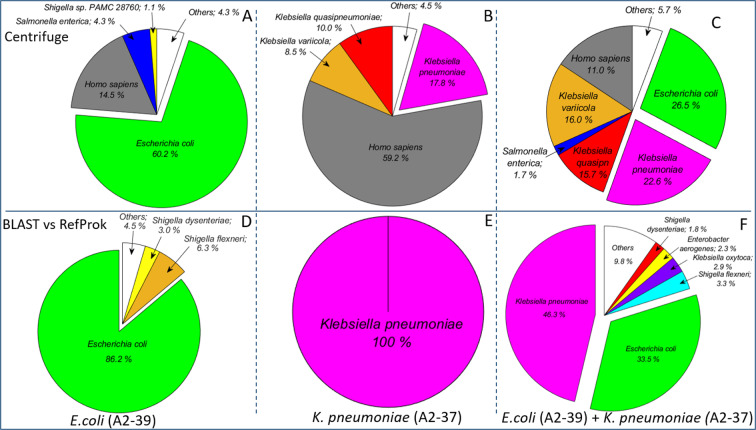
Figure 1.
Relative distribution of reads in sequence data generated by nanopore sequencing of DNA purified from the three selected blood cultures. The blood cultures were spiked with E. coli A2-39 (A and D), K. pneumoniae A2-37 (B and E) and E. coli A2-39 + K. pneumoniae A2-37 (C and F). Upper panel (A–C) show results obtained using Centrifuge and lower panel (D–F) show results based on BLAST search against the RefProk database that contains prokaryotic sequence data only. The “Others” group represents taxa with relative read counts below 1%. All results are based only on the first output file for each experiment from the MinION sequencing platform, containing 4000 reads (available after approximately 10 minutes of sequencing).

