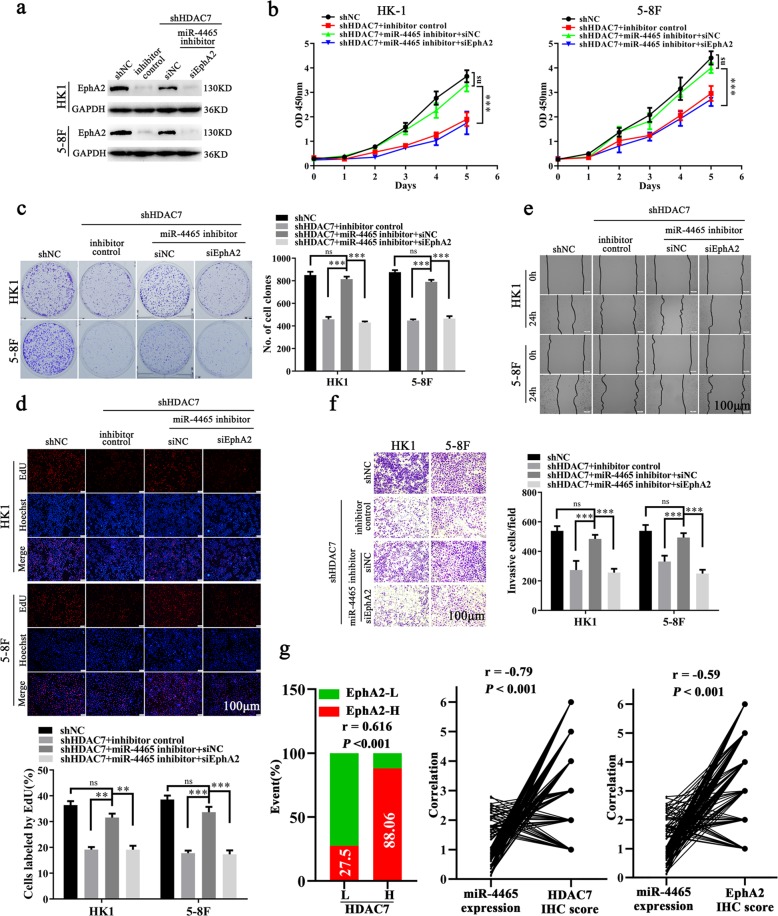
Fig. 6. HDAC7 promotes NPC cell proliferation, migration, and invasion by miR-4465-EphA2 axis.
a Western blot showing the levels of EphA2 in the shHDAC7 HK1 and 5–8F cells transfected with miR-4465 inhibitor or co-transfected with miR-4465 inhibitor and EphA2 siRNA (siEphA2), and their control cells. b–f The effects of miR-4465 inhibitor transfection or miR-4465 inhibitor and siEphA2 co-transfection on NPC cell proliferation, and migration and invasion. CCK-8 (b), plate clone formation (c), and EdU incorporation (d) assay showing the proliferation of shHDAC7 HK1 and 5–8F cells transfected with miR-4465 inhibitor or co-transfected with miR-4465 inhibitor and siEphA2, and their control cells. e Scratch wound healing assay showing the migration of shHDAC7 HK1 and 5–8F cells transfected with miR-4465 inhibitor or co-transfected with miR-4465 inhibitor and siEphA2, and their control cells. f Transwell Matrigel invasion assay showing the invasion of shHDAC7 HK1 and 5–8F cells transfected with miR-4465 inhibitor or co-transfected with miR-4465 inhibitor and siEphA2, and their control cells. g Correlation analyses of HDAC7, miR-4465, and EphA2 in 107 NPC based on their expression levels. (Left) Spearman correlation analysis showing the positive correlation between HDAC7 and EphA2. (Right) Spearman correlation analysis showing the negative correlation between miR-4465 and HDAC7, and miR-4465 and EphA2. Means, SDs, and statistical significance are denoted; **P < 0.01; ***P < 0.001; ns no significance.

