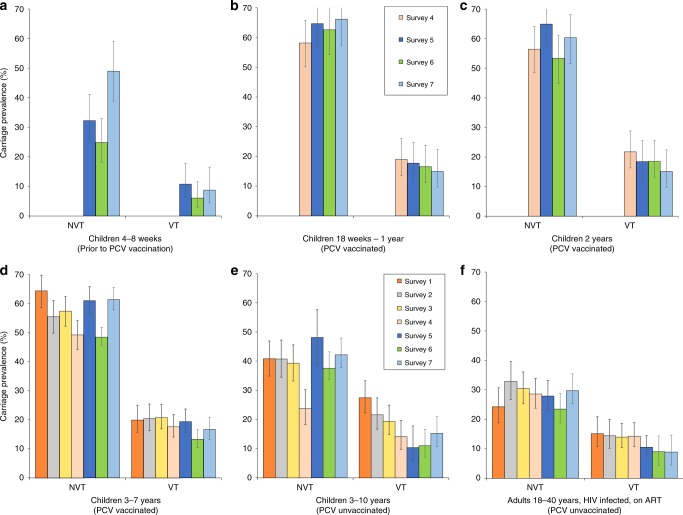
Fig. 2. S. pneumoniae carriage prevalence per survey, stratified by study group.
Surveys 1–7 spanned a time of 3.6–7.1 years after the 12 November 2011 introduction of PCV into Malawi’s EPI program. Younger children (4–8 weeks up to 2 years of age; cells a–c) were recruited starting survey 4 or 5. Prevalence of non-carriers is calculated by 1 − (NVT + VT). Aggregated sample size for each study group: a n = 346 children 4–8 weeks old (PCV-unvaccinated), b n = 566 children 18 weeks to 1 year old (PCV vaccinated), c n = 499 children 2 years old (PCV vaccinated), d n = 2565 children 3–7 years old (PCV vaccinated), e n = 1402 children 3–10 years old (PCV-unvaccinated), f n = 1770 HIV-infected adults on ART (PCV-unvaccinated). Refer to Supplementary Tables 3 and 4 for the sample sizes used in calculating per-survey VT and NVT prevalence data and error bars in this figure. 95% confidence interval error bars are shown. The confidence interval bounds are calculated by exponentiating the bounds in the logit scale.

