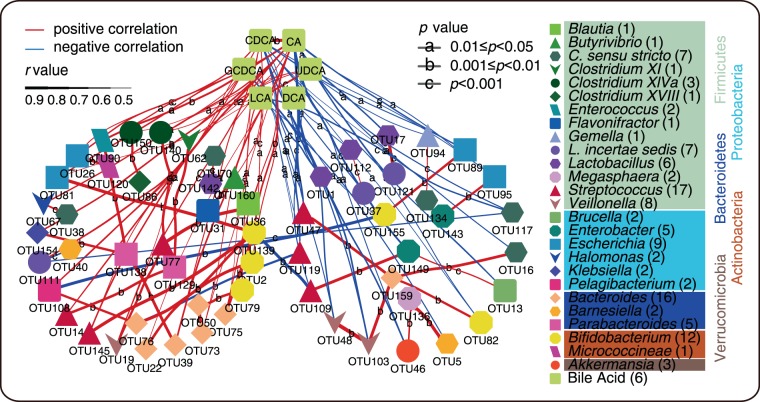
Figure 4.
Significant correlative relation between BAs and microbiota. Colorful and various shapes points in the network mean OTUs or BAs, the color of points means genus of OTUs (numbers in the bracket present OTU numbers). The colorful panes under the genus names mean different phyla (phylum name own the same color with the panes’). The red and blue lines mean positive and negative correlation respectively. The width of lines and letters on the line represents the r-value and the p-value of the correlative relation respectively.

