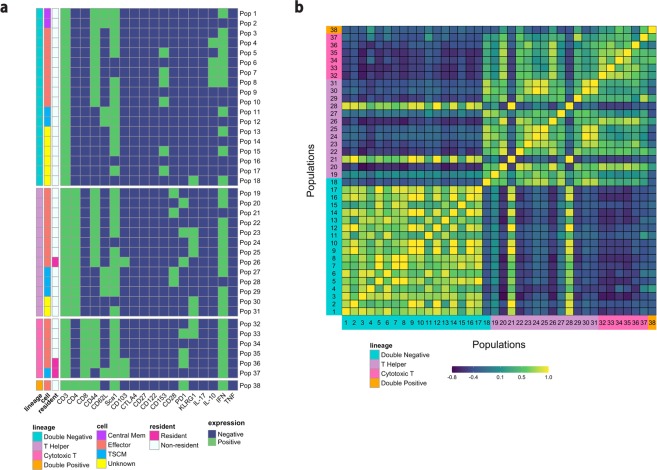
Figure 3.
Feature engineering identifies CD3+ phenotypes and correlates identified populations. (a) The heatmaps show the CD3+ phenotypes that constitute greater than 0.5% of the live leukocytes in at least one sample. Green indicates positive expression, and blue indicates negative expression of all 18 markers used for analysis in the flow cytometry experiment on the x-axis. The plots are separated by four different CD3+ lineages based on CD4 and CD8 expression (double negative immune cells, T helper cells, cytotoxic T cells, and double positive T cells). The “cell” column classifies cells as either central memory, effector, T stem-cell like memory, or unknown cells that need to be explored further. The “resident” column indicates if the population is a resident cell, as determined by expression of CD103. (b) The correlation across study samples between the percentage of cells in each population can be used to see the similarities and differences between different populations. Yellow indicates high positive correlation and purple is high negative correlation. Populations are grouped by cell lineages, and each number on the x-axis and y-axis identifies a separate cell population, corresponding to the population numbers in Fig. 3a.

