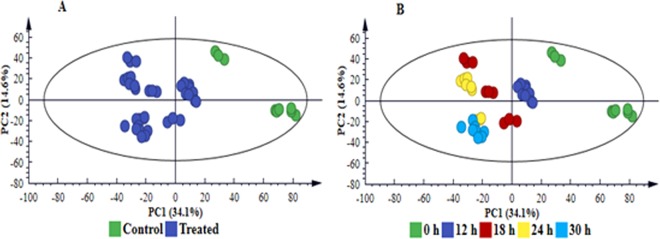
Figure 4.
PC analyses of the LC-MS ESI(−) data for intracellular sorghum cell extracts. The 4-component model explains 61.9% variation in Pareto-scaled data, X, and the amount of predicted variation by the model, according to 7-fold cross-validation, is 51.4%. The 7-fold CV procedure is described in the experimental section. (A) Clusters coloured based on condition i.e. non-treated vs. treated shows clear separation between treated and control (non-treated, 0 h) samples. (B) is the same scores plot but coloured according to time and showing a clear sequential time trend clustering (from C0 h and T12–30 h). The related model for ESI( + ) data is supplied as Fig. S4, n = 9.

