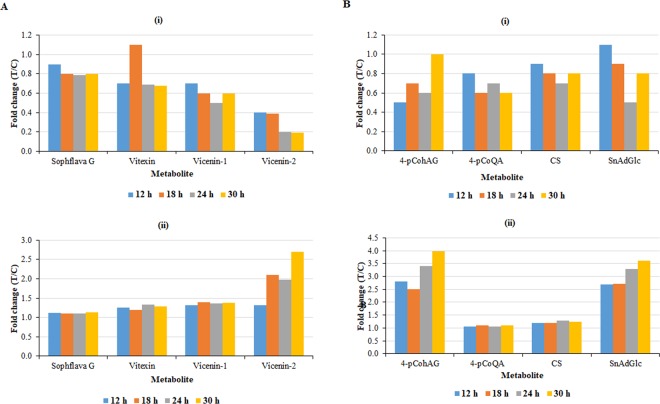
Figure 9.
Relative quantification of some flavonoids (A) and hydroxycinnamic acids (B) annotated in (i) intracellular and (ii) extracellular extracts, and induced by LPSB.a. treatment of sorghum cells. The relative levels of each metabolite are expressed in fold changes, and computed from treated against control (C0 h) samples i.e. T/C, where fold change ≥1 represents significant accumulation, n = 9. Sophflava G = sophoraflavanone G; vicenin-1 = apigenin 6-C-xyloside-8-C-glucoside; vicenin-2 = apigenin-6,8-di-C-glucoside; vitexin = apigenin-8-C-glucoside 4-pCohAG = 4-coumaroyl-3-hydroxyagmatine; 4-pCoQA = 4-coumaroylquinic acid; CS = cinnamoylserotonin; SnAdGlc = sinapaldehyde glucoside.

