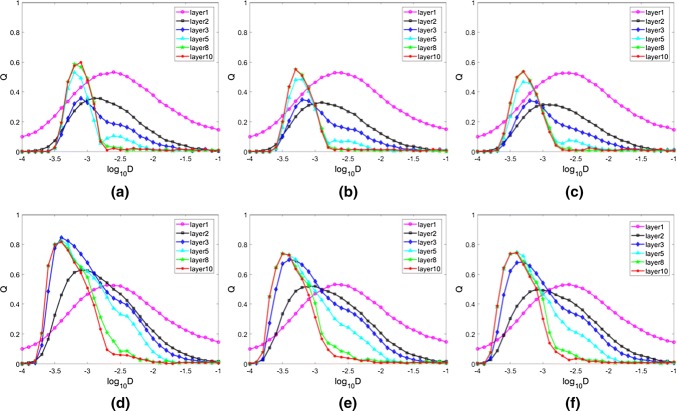
Fig. 3.
Linear response Q as a function of noise intensity for different layers of FFNs with identical distribution (a ,d), uniform distribution (b, e) and exponential distribution (c, f) respectively. aP = 0.15; bP = 0.15; cP = 0.15; dP = 0.3; eP = 0.3; fP = 0.3. The input signal is set the same as A = 0.08 and Ts= 5 for a–f

