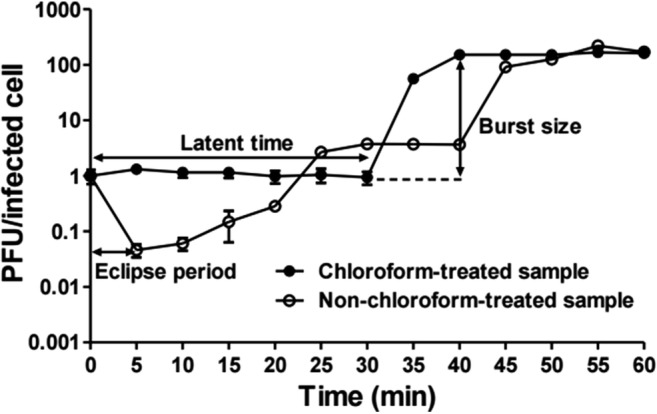
Fig. 6.

One step growth curve analysis of KFS-EC. The mixture of E. coli O157:H7 ATCC 43895 and KFS-EC at an MOI of 0.01 was incubated for 1 h at 37 °C under agitation. The mixture was collected every 5 min and divided into two groups as a non-chloroform treatment (○) and 1% chloroform treatment (●) for the determination of eclipse period, latent time, and burst size. The data represents the mean ± SD (n = 3)
