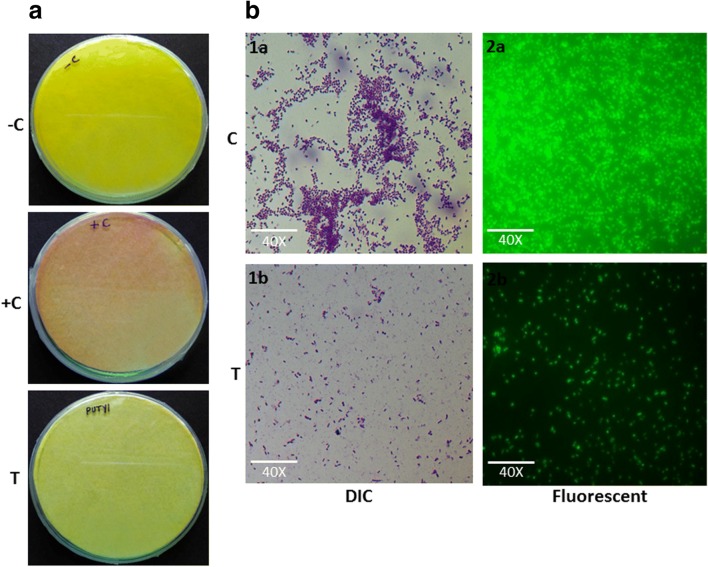
Fig. 5.
(A) Effect of M. indicus extract at a concentration of 750 μg/mL on HCN production by P. aeruginosa (−C, +C, and T represent negative control, positive control, and treated with M. indicus extract respectively). (B) Microscopic observation of effect of M. indicus extract at 750-μg/mL dose on biofilm formation by P. aeruginosa. Differential interference contrast (DIC) microscope observation of biofilm formation by P. aeruginosa when treated by M. indicus extract (1b) in comparison with control (1a). Fluorescence microscopic observation of biofilm formation when treated by M. indicus extract (2b) in comparison with control (2a)

