Fig. 2.

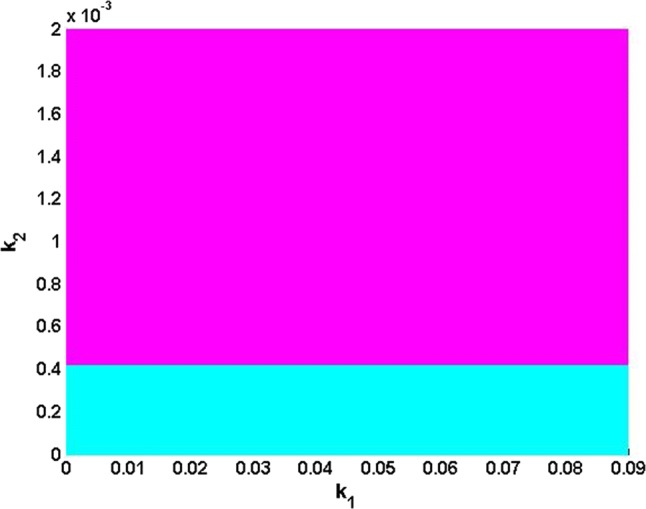
Basin stability of equilibrium point in the plane showing the region where this equilibrium point is stable/quasi-stable (cyan) and the region where it is unstable (magenta) for ,, while keeping and

Basin stability of equilibrium point in the plane showing the region where this equilibrium point is stable/quasi-stable (cyan) and the region where it is unstable (magenta) for ,, while keeping and