
Fig. 1.
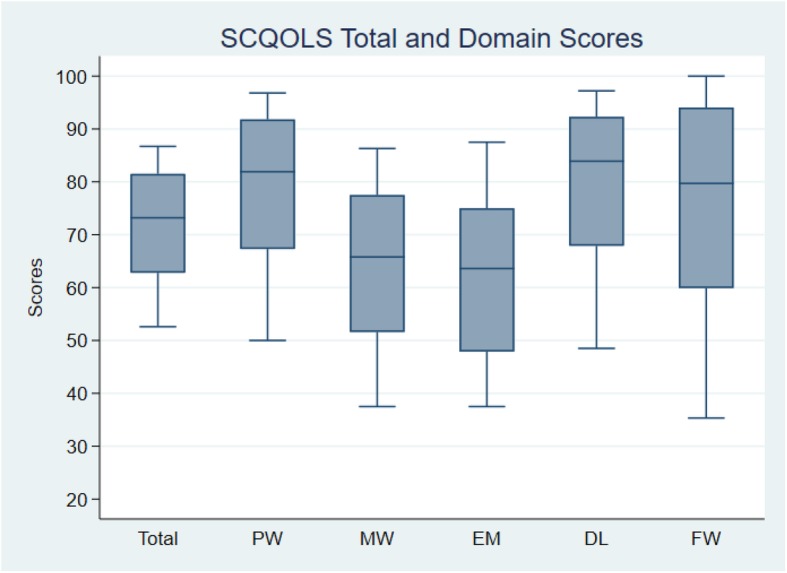
Plots of 10th, 25th, 50th, 75th and 90th percentiles of quality of life scores of caregivers in a “mild” state (patient performance status =1 and caregiver role =1) and, where applicable, in the most common demographic category (ethnic Chinese and tertiary education) and at mean age (48 years) in the survey. Calculation based on equations in Tables 3, 4, 5, 6, 7, 8. PW: Physical Well-being; MW: Mental Well-being; EM: Experience & Meaning; DL: Impact on Daily Life; FW: Financial Well-being