
Fig. 4.
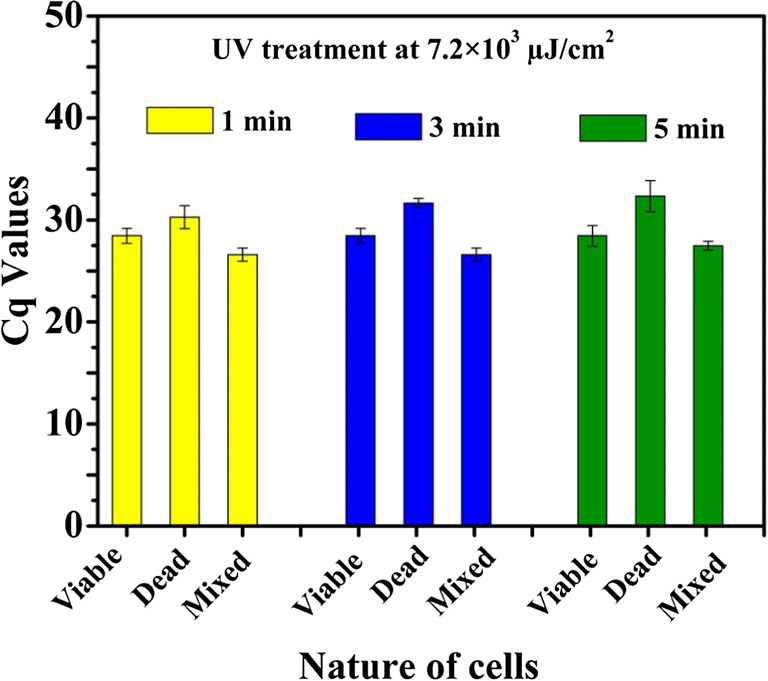
UV treatment at 7.2 × 10³ μJ/cm2 to viable, killed, and mixture of viable and killed cells of Escherichia coli MTCC 3221 cells for 1, 3, and 5 min. Each bar represents the average Cq value of a triplicate experiment ± standard deviation
Official websites use .gov
A
.gov website belongs to an official
government organization in the United States.
Secure .gov websites use HTTPS
A lock (
) or https:// means you've safely
connected to the .gov website. Share sensitive
information only on official, secure websites.
UV treatment at 7.2 × 10³ μJ/cm2 to viable, killed, and mixture of viable and killed cells of Escherichia coli MTCC 3221 cells for 1, 3, and 5 min. Each bar represents the average Cq value of a triplicate experiment ± standard deviation