
Fig. 5.
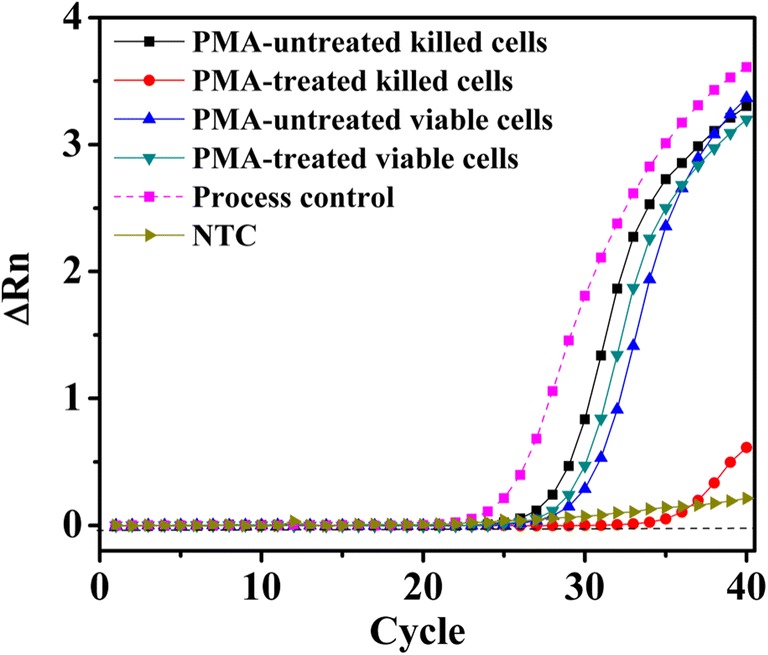
Amplification plot for comparison between PMA-treated and PMA-untreated viable and killed cells using UV light for 3 min at 4.8 × 10³ μJ/cm2. ∆Rn, fluorescence intensity change; NTC, no template control
Official websites use .gov
A
.gov website belongs to an official
government organization in the United States.
Secure .gov websites use HTTPS
A lock (
) or https:// means you've safely
connected to the .gov website. Share sensitive
information only on official, secure websites.
Amplification plot for comparison between PMA-treated and PMA-untreated viable and killed cells using UV light for 3 min at 4.8 × 10³ μJ/cm2. ∆Rn, fluorescence intensity change; NTC, no template control