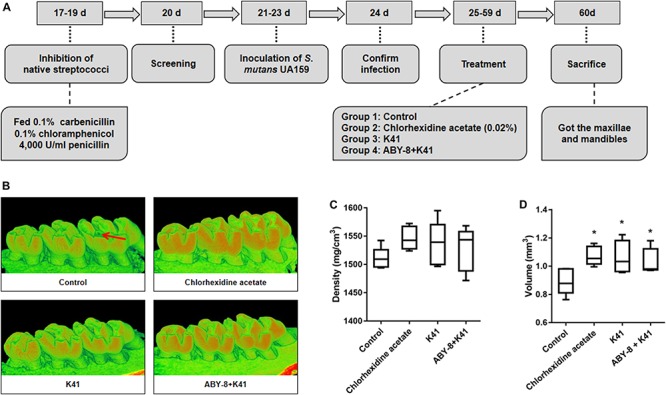
FIGURE 4.

The observation and enamel analysis of maxillary by Micro-CT. (A) Flow chart of animal model. (B) Three-dimensional images of the molar area (right column) of the left mandible. (C) Density of the first molar enamel. (D) Volume of the first molar enamel. Control: deMan-Rogosa-Sharpe media; ABY-8: a mixture culture of S. thermophilic and L. bulgaricus. “*”: significant difference compared with control group (P < 0.05). Red arrows in Figure 4B were for tooth cavity. The red and green represented the degree of the mineralization, and the redder color means the higher degree of mineralization.
