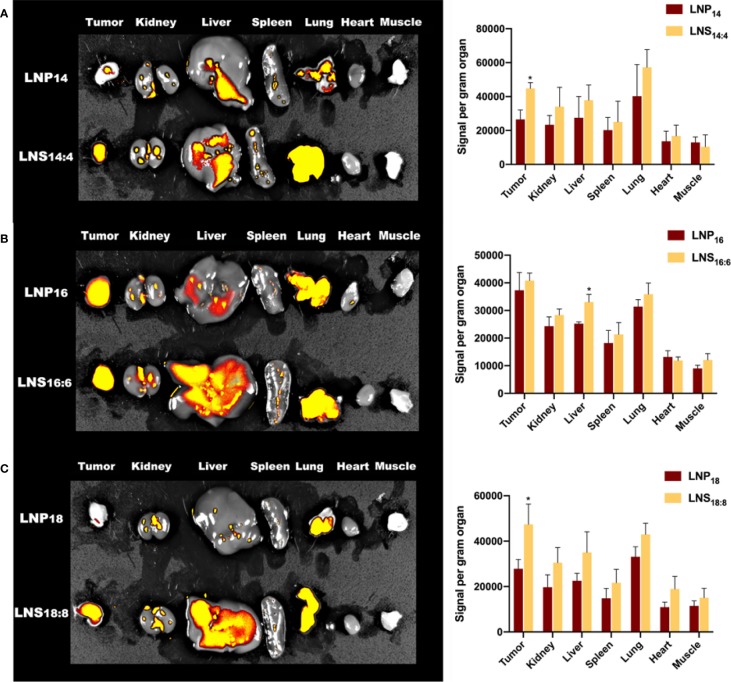
Figure 4.
Biodistribution of the lipid nanoparticles (LNPs) and lipid nanostars (LNSs). The image (left) and quantification (right) of in vivo biodistribution (BioD) of the LNPs (up) and LNSs (down) prepared by the lipid with backbone of C14/C4 (A), C16/C6 (B), C18/C8 (C). *p < 0.05, compared with relevant spherical control group.

