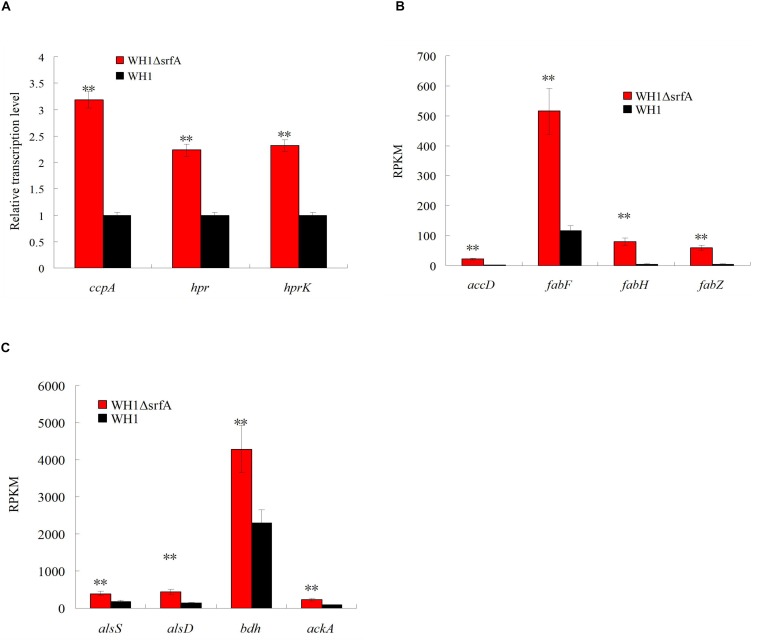
FIGURE 4.
Comparison of the transcription of ccpA and the genes controlled by CcpA between ΔsrfA and WH1. (A) Transcription of ccpA, hpr, and hprK. (B) Transcription of genes involved in biosynthesis of fatty acids. (C) Transcription of genes involved in carbon overflow metabolism. (A) was analyzed by qRT-PCR, and (B) and (C) were analyzed on the basis of transcriptomes. Double stars indicate significant difference (p < 0.01) between ΔsrfA and WH1.

