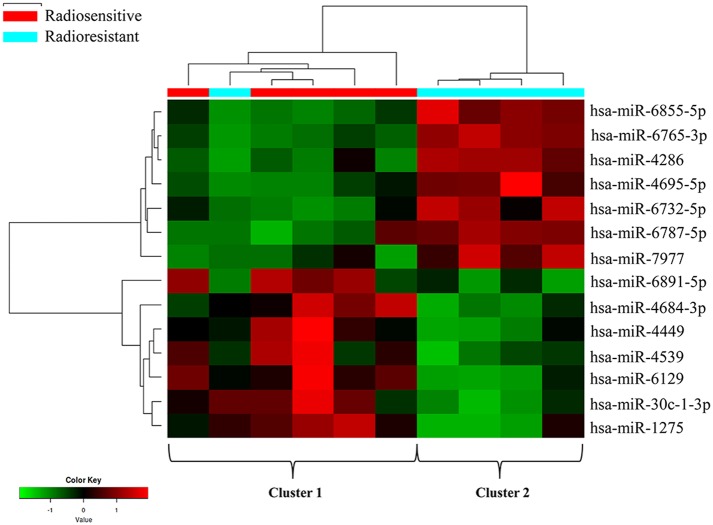
Figure 2.
Clustering analysis of the radioresistant and radiosensitive groups using differentially expressed miRNAs. The columns represent the cases, and the lines represent the miRNAs. Red and green indicate high and low expression levels, respectively. Cluster 1: five radiosensitive and one radioresistant; cluster 2: radioresistant.

