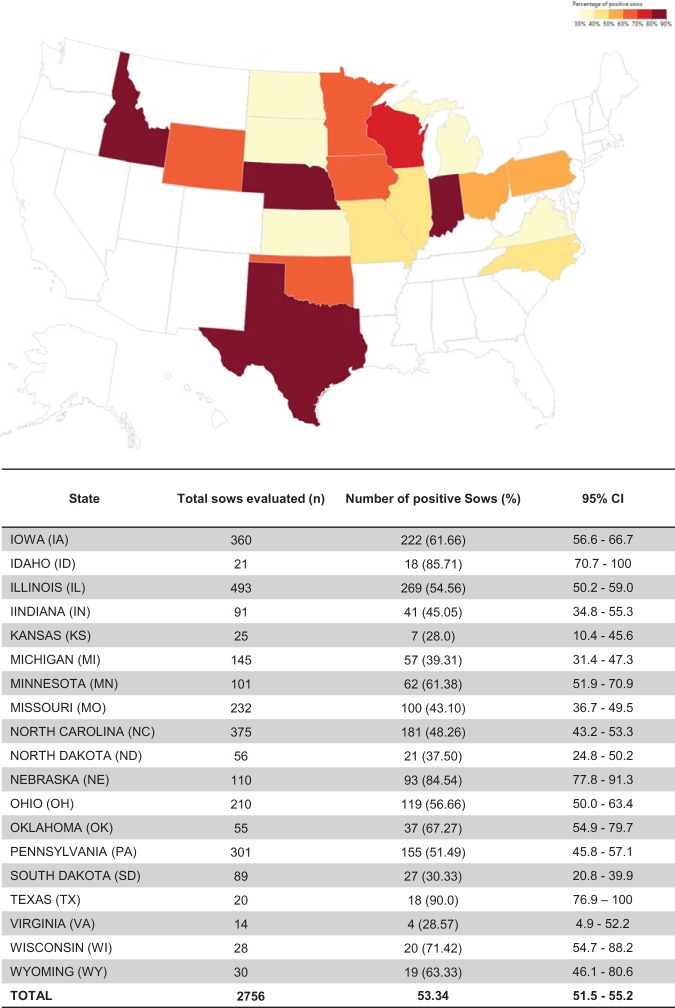
FIG 5.
Geographic distribution of PHEV seropositive sows (overal invididual prevalence by state) in the United States. The map indicates the percentages of PHEV-seropositive sows detected by state. The table indicates the total numbers evaluated and percentages of positive sows by state with the 95% confidence intervals (CIs).

