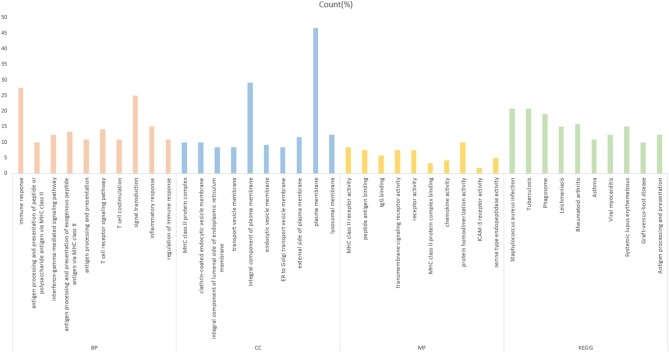
Figure 3.
Gene Ontology analysis of the yellow module genes. The abscissa is the percentage of enriched gene entries in the total number of genes in this item, and the orange, blue, yellow, and green colors represent the BP-, MF-, CC-, and KEGG-enriched entries, respectively. The entries enriched by each item are arranged from left to right in the order of the P-value from small to large, with all P < 0.05.

