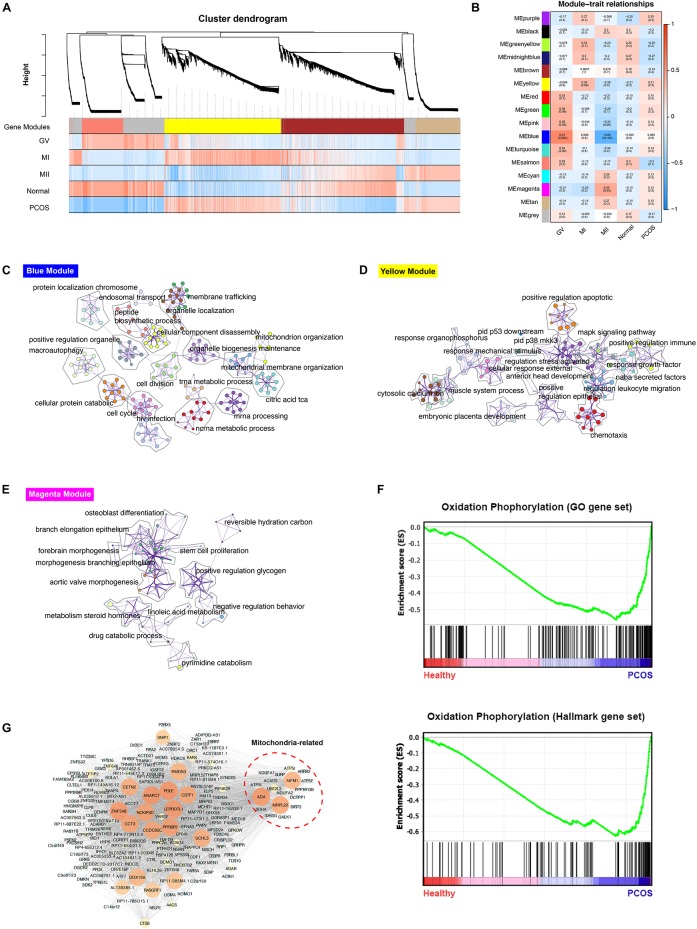
FIGURE 2.
WGCNA analysis of healthy and PCOS oocytes in different stages. (A) The dendrogram of gene modules built by WGCNA. Bars represent the correlation between genes in different developmental stage of oocyte and gene modules. Red means positively correlation and up-regulated at this stage; blue means negatively correlation and down-regulated at this stage. (B) Module-trait relationship between different gene modules. Number in each cell represent the degree of correlation, and red means positively correlation at this stage; blue means negatively correlation at this stage. Different colors represent the diverse specific gene modules detected by WGCNA. C-E. Network of enriched GO terms of genes containing in blue module (C), yellow module (D) and magenta module (E) separately, colored by GO cluster ID. (F) The results of Gene set analysis (GESA) for hallmark gene sets (up) and GO biological processes gene set (down). The enrichment score (ES) means value of maximum deviation from 0 of the running sums and each line on the button represent the different genes of gene set. (G) Co-expression network of hub genes containing in blue module illustrated by the Cytoscape. The large size and the bright color of nodes represented high MCODE score of genes.

