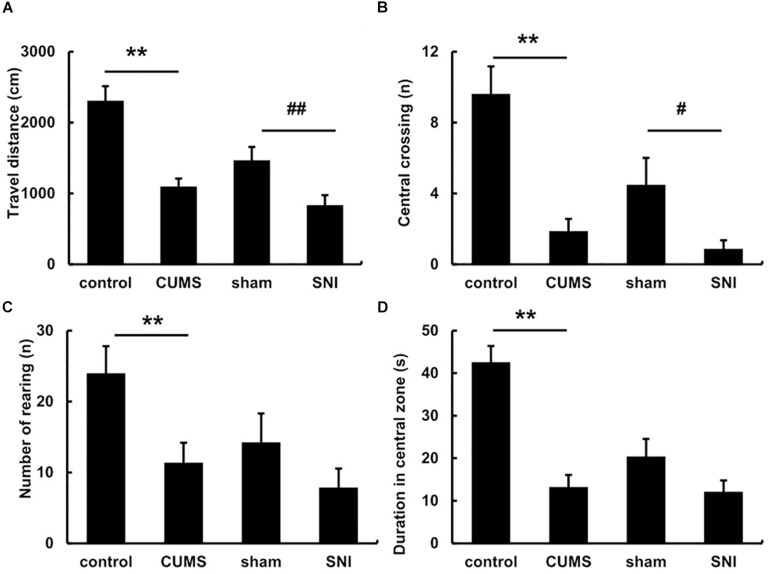
FIGURE 2.
The open field behavior change in the total travel distance (A), the frequency of central crossing (B), number of rearing (C) and the duration of the central zone (D) after exposure to chronic stress for 5 weeks. Data are shown as mean ± standard error (M ± SEM). N = 8. **p < 0.01 vs. control group. #p < 0.05 vs. SNI-sham group.

