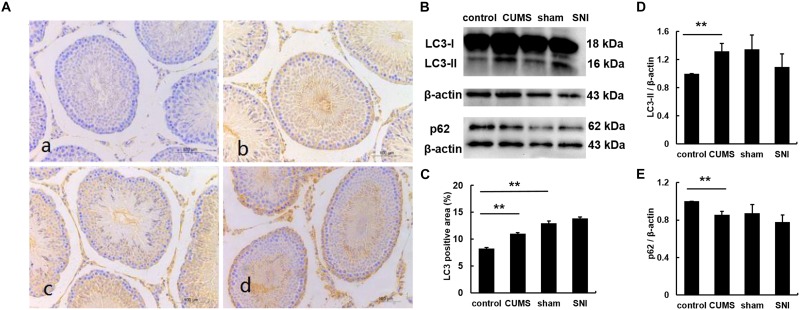
FIGURE 5.
The expression of LC3B protein in the testis tissues of four groups (a, control group; b, CUMS group; c, SNI-sham group; d, SNI group) by IHC staining (A), and the LC3 positive area was quantified (C). The expression of LC3 and p62 in the testis tissues of four groups (B,D,E) by western blot. Data are shown as mean ± standard error (M ± SEM). N ≥ 6. **p < 0.01 vs. control group.

