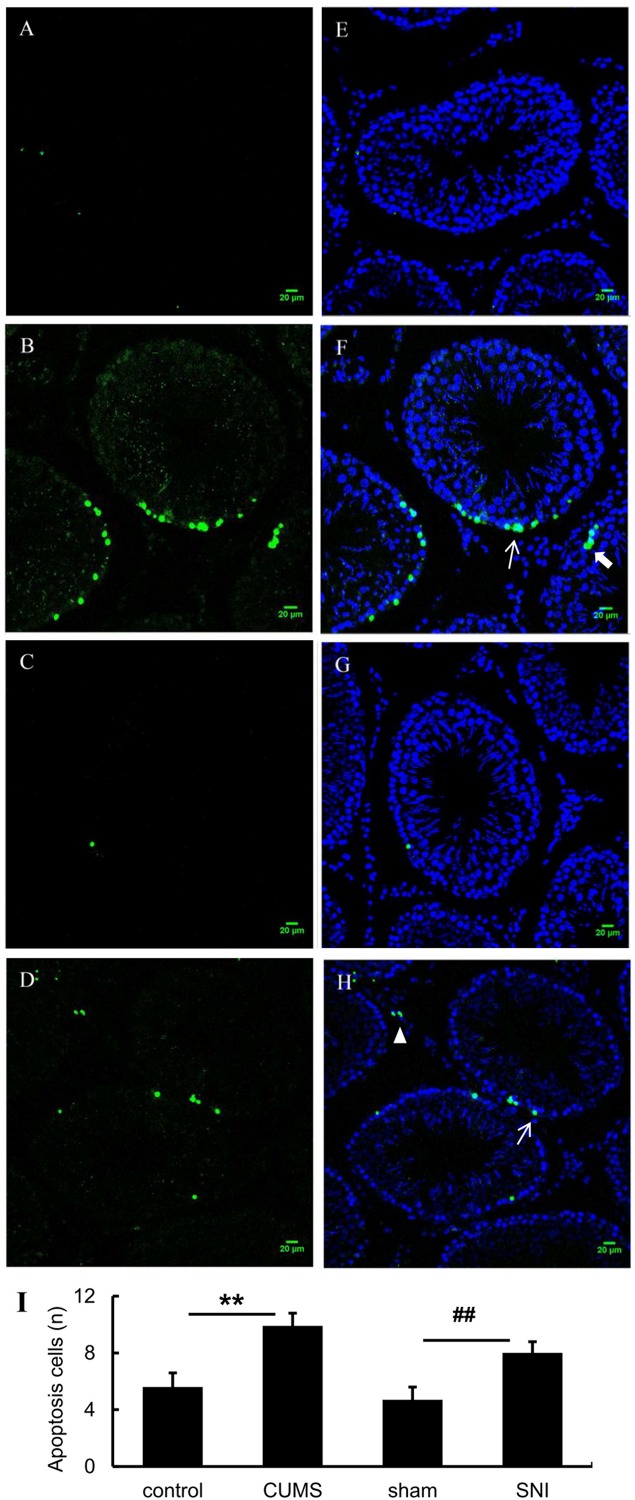
FIGURE 6.
TUNEL (green) positive apoptotic cells in rat testis induced by chronic stress (A, control group; B, CUMS group; C, SNI-sham; D group, SNI group). The nuclei were counter-stained with DAPI (E, control group; F, CUMS group; G, SNI-sham group; H, SNI group). Quantitative analysis of TUNEL staining (I) are shown as mean ± standard error (M ± SEM). N ≥ 6. **p < 0.01 vs. control group. ##p < 0.01 vs. SNI-sham group.

