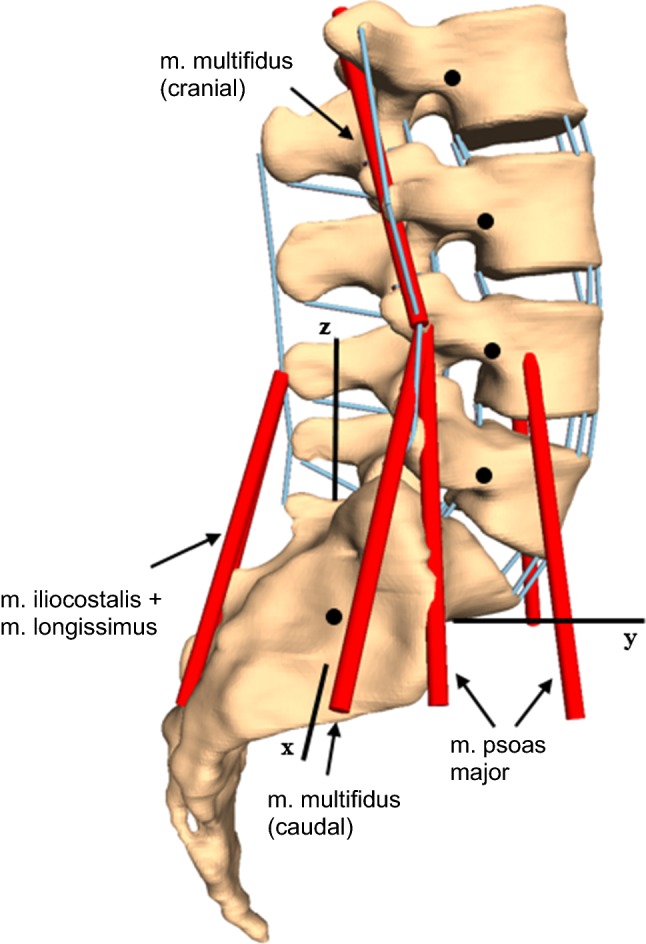
Fig. 3.

L2–S1 lumbar spine MBS model based on CT data including passive force-transmitting structures (IVD, ligaments (blue lines), facet joints) and the musculature represented by wire cables (red lines). Black dots represent the centers of mass of single vertebrae
