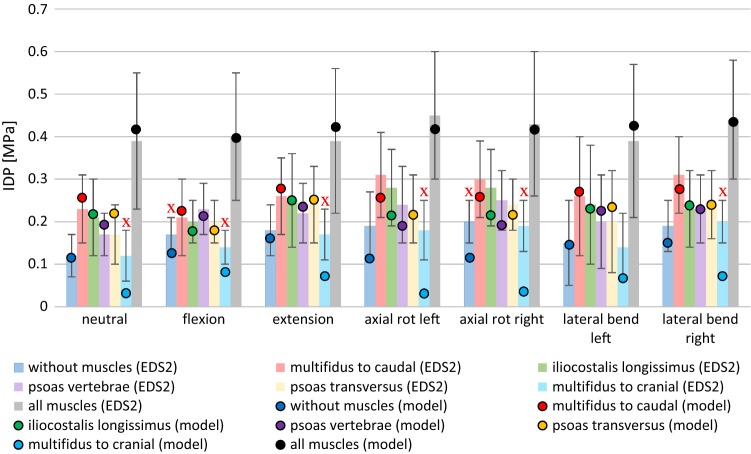
Fig. 7.
Bar plot showing experimentally determined IDP values (Wilke et al. 1996) in the L4–L5 disk under different loading conditions (EDS2). Colored bars represent the mean IDP values for different active muscle groups (wire cables): (i) none, (ii–vi) single muscle groups, and (vii) all muscles simultaneously. Black error bars represent the standard deviation. The correspondingly colored circles show our model output. Red crosses show the eight outliers, see Appendix 3

